
Welcome to today’s post.
In today’s post I will show how to remotely debug an ASP.NET Core web application hosted in Azure as an Azure Application Service Instance.
I will also be giving a brief overview of the following tasks:
- Deploying an ASP.NET Core web application to Azure from Visual Studio 2022.
- Setup an Azure Application Service Instance for remote debugging.
- Setup an ASP.NET Core web application source for remote debugging.
- Attaching to a running remote Azure Application Service Instance from Visual Studio 2022.
You will already be familiar with debugging ASP.NET Core web applications hosted locally from IIS Express from within Visual Studio. When running web applications within Visual Studio that are built with the Debug environment release mode, debug symbols are embedded within the application binary outputs, that include dynamic link libraries (DLLs) and executables (EXEs). The debug symbols embedded within the application binaries reference application source code line numbers, that allow us to set breakpoints within the source code and pause the application during a debugging session to allow us to inspect application variables and data structures. During the debugging session, we can step through each line of code or continue through source code until we reach other breakpoints or the end of the program.
The difference between debugging locally and debugging remotely is the location of the running application. With local debugging, the developer has access to run and debug an instance of the web application on the local web server.
With remote debugging, the application is hosted remotely, and our debugging tools are located on a local development machine. Provided we have access to the remotely hosted application instance, we can connect to the remotely running instance and conduct a debugging session.
I the sections that follow, I will cover the following tasks:
- Deploying an ASP.NET Core web application to Azure.
- Setting up the application’s service instance for remote debugging.
- Setting up the application’s source for remote debugging.
- Stepping through application code within a remote debugging session.
Deploying an ASP.NET Core Web Application to Azure from Visual Studio 2022
I will go through the task of deploying an ASP.NET Core web application to an Azure Application Service instance from Visual Studio.
The deployment of ASP.NET Core web applications has been possible since earlier versions of Visual Studio including 2017 and 2019. I will show how this is done with Visual Studio 2022.
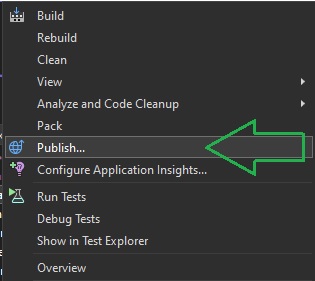
First, in the solution explorer of the project context menu, select the Publish… option.
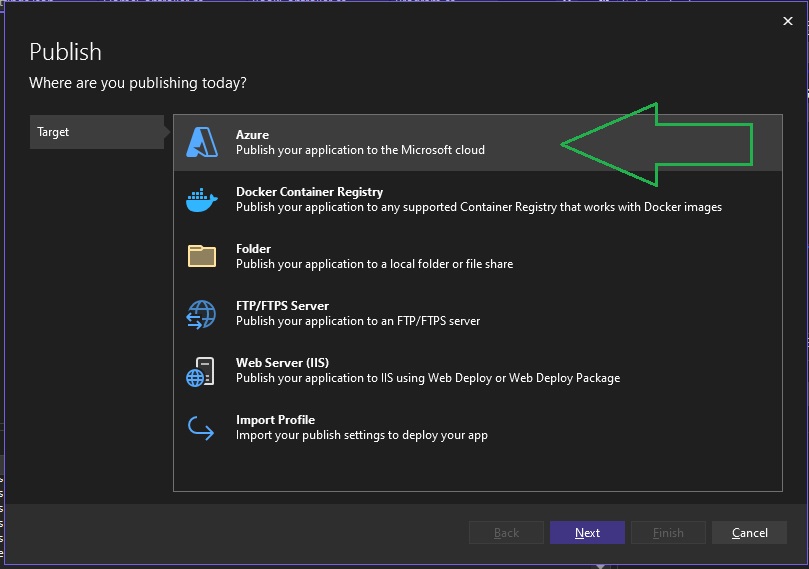
Next, select the destination where the application will be published. To publish the application changes to Azure, choose the Azure option as shown:
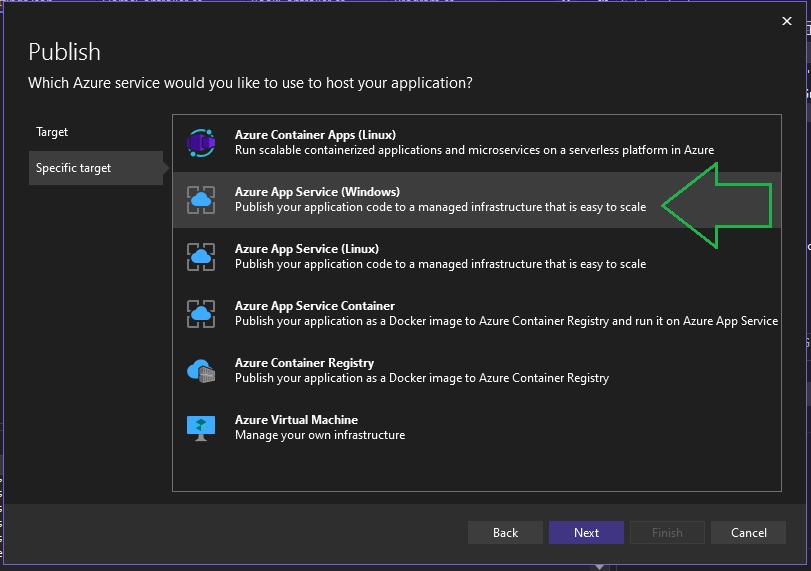
Next, there are some options that are available depending on the environment you wish to target, Windows or Linux, and either an Azure App Service or an Azure Container App.
In this case, as my environment is Windows, I will choose the Azure App Service (Windows) as the destination:
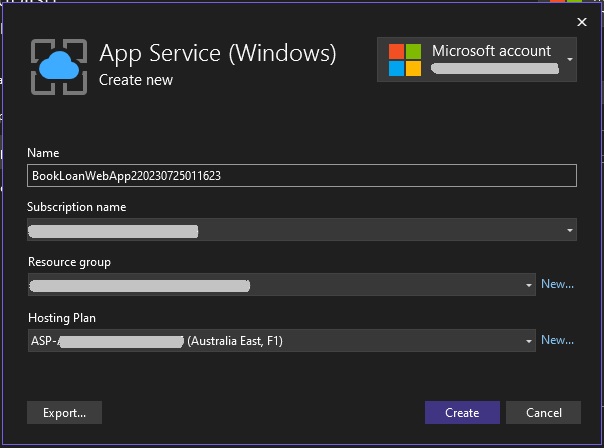
In the next screen, you will be required to select an existing Azure subscription, a new or existing Resource Group, and a new or existing Application Hosting Plan. In this case, I have selected existing resource groups and hosting plans. For purposes of this overview, you can choose the free F1 tier of the application hosting plan:
After hitting the Create button, you will be shown the setting and hosting configurations, and the site URL, which is of the form:
https://[application service instance].azurewebsites.net
In the publishing Wizard, the site will be shown in the Hosting section:
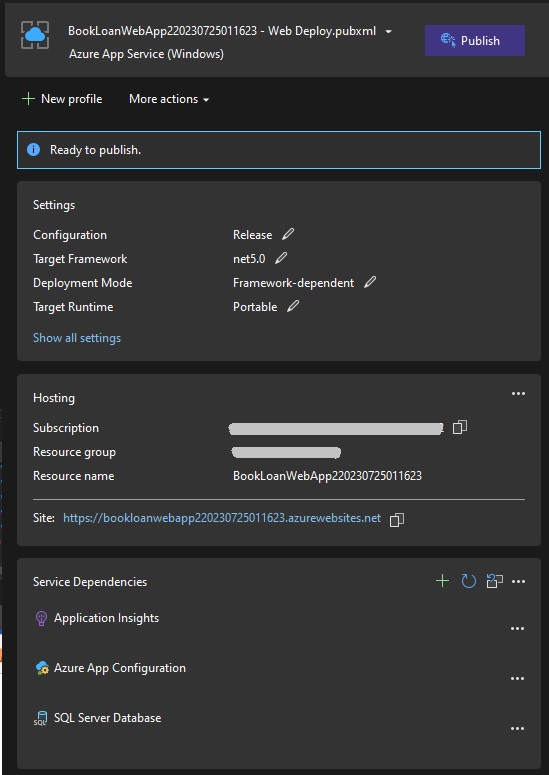
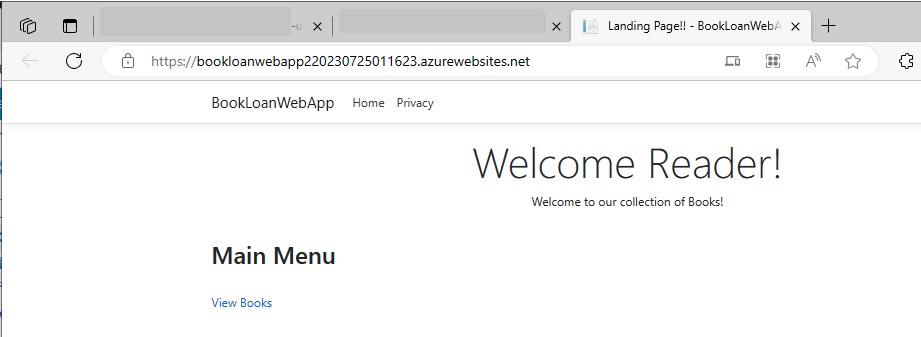
The web application in Azure can be run direct from the browser using the above URL to ensure that it runs without any other configurations impeding its execution.
In the next section, we will see how to setup an Azure application services instance for remote debugging.
Setup an Azure Application Service Instance for Remote Debugging
I will show how to setup an Azure Application Service Instance for remote debugging.
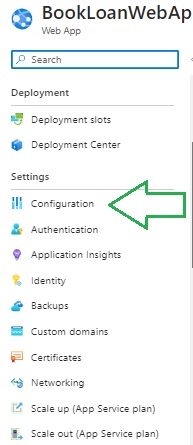
In the Azure Portal, open the Azure Web App overview.
Under the Settings menu select the Configuration option.
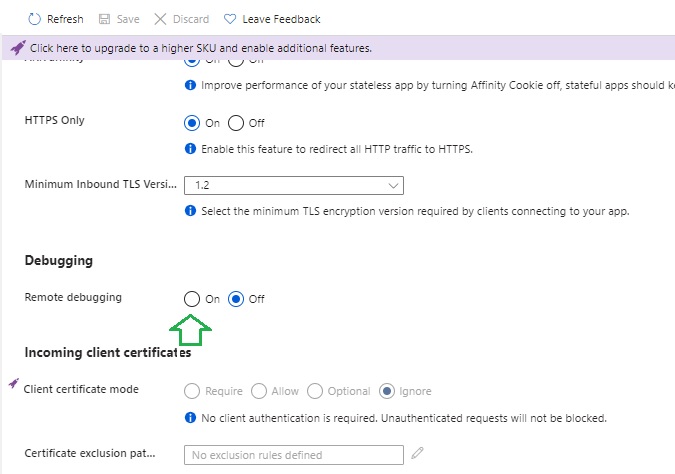
The configuration screen will open, and you will see some configuration tabs. Select the General Settings tab as shown:
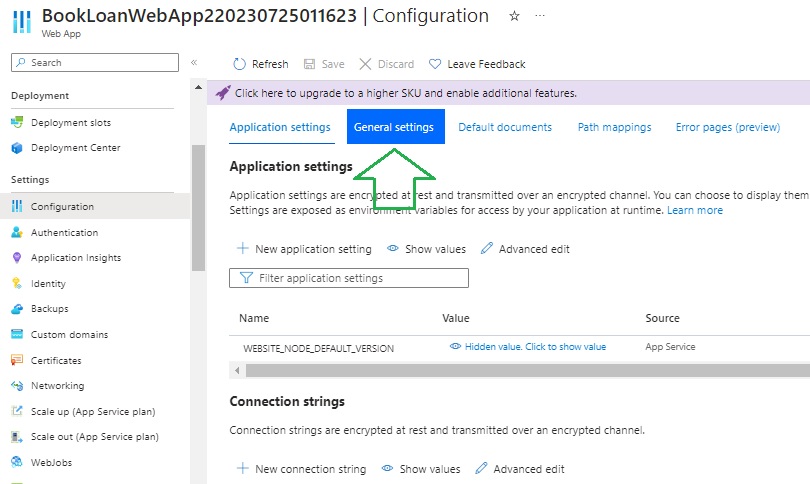
Next, scroll down to the section with the heading Debugging. Below the heading you will see a pair of radio buttons that allow you to choose the Remote debugging option. Set the remote debugging option to On as shown:
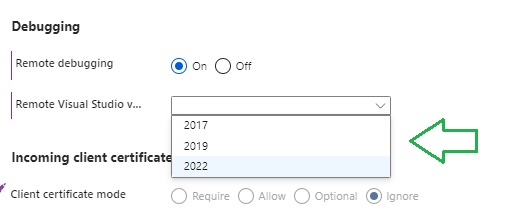
The next option below the Remote Debugging option is the Remote Visual Studio Version. This should match the version of Visual Studio you are using to debug remotely from your development machine. This allows the correct remote debugging process to run when you connect to the web application instance in Azure. In my case, I will select 2022 as I am using Visual Studio 2022.
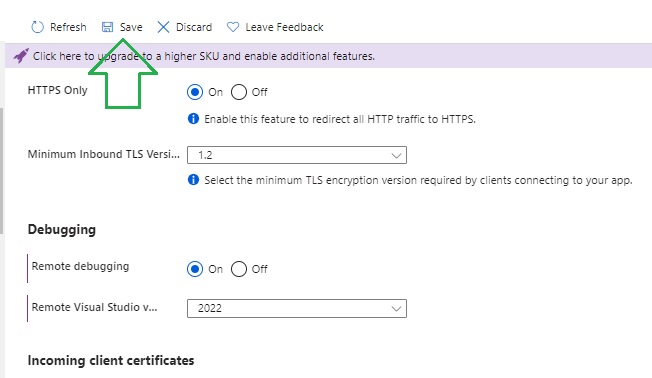
Next, I will save the changes to the Azure Web App configuration. The changes will take some time to be applied to the web application, which will be restarted.
In the next section, we will see how to setup the web application’s source for remote debugging.
Setup the ASP.NET Core Web Application’s Source for Remote Debugging
I will next setup an ASP.NET Core web application project’s source for remote debugging.
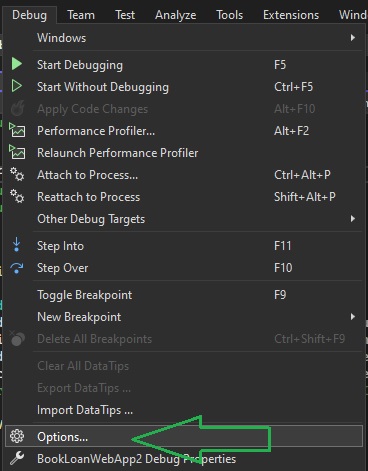
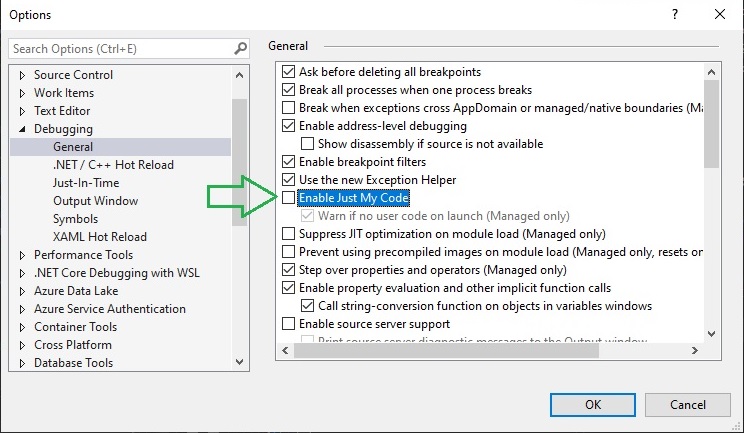
Open the Debug menu, and select the Options… option as shown:
In the Options dialog in the General sub-options, you will see the option Enable Just My Code.
The Just My Code debugging option allows a debugging session to skip over non-user (also known as External Code) code such as framework code and operating system code.
Uncheck the option as shown:
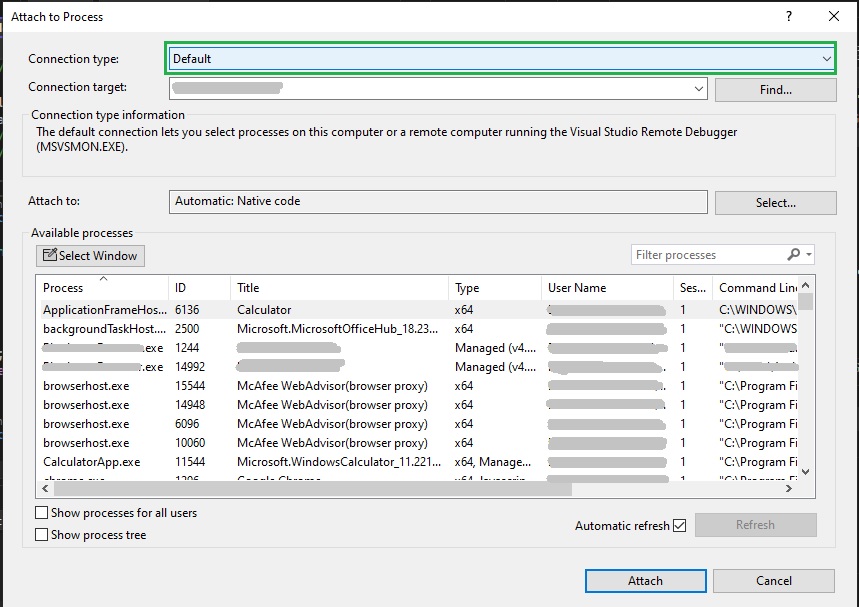
After selecting the debug options, the Attach to Process dialog will open.
You will see two required parameters:
Connection type
Connection target
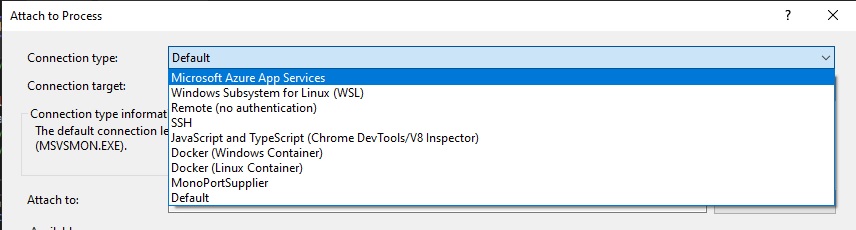
The above two choices for the Connection Type are shown in the Attach to Process dialog below:
The connection type shows the types of remote connections including Microsoft Azure App Service, Docker (Windows), Docker (Linux), Remote.
For our remote Azure Web App, we choose the Microsoft Azure App Service connection type:
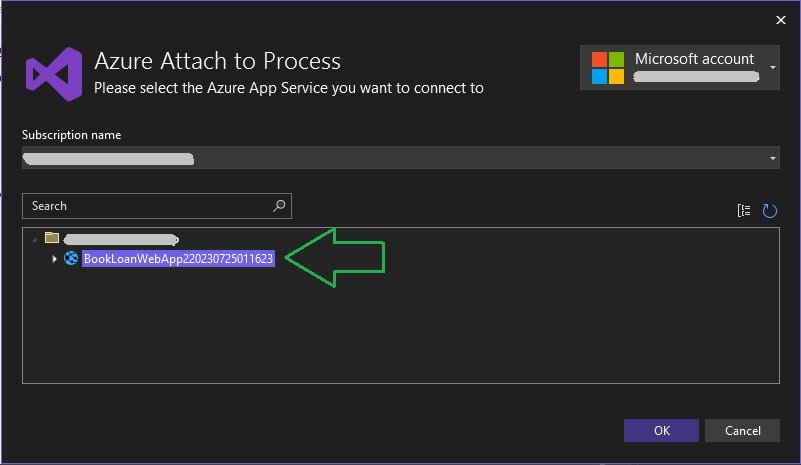
To determine the connection target, we click on the Find… button.
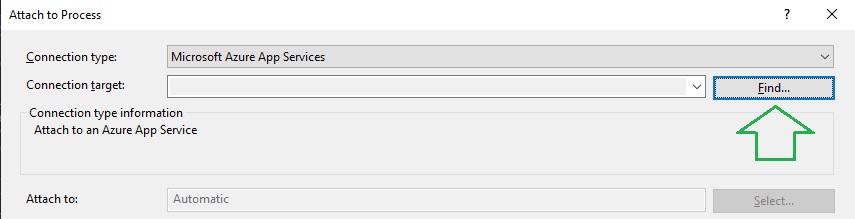
This opens a dialog that will require you to connect to your Azure subscription. After establishing authentication to an Azure subscription, you will see a list of resource groups. Expand the resource group that contains the Azure Web App that you had published to Azure earlier. Then select the Azure Web App instance that you want to connect to remotely.
After hitting the Ok button, your local web application will display the remote IIS web application worker process, w3wp.exe as shown:
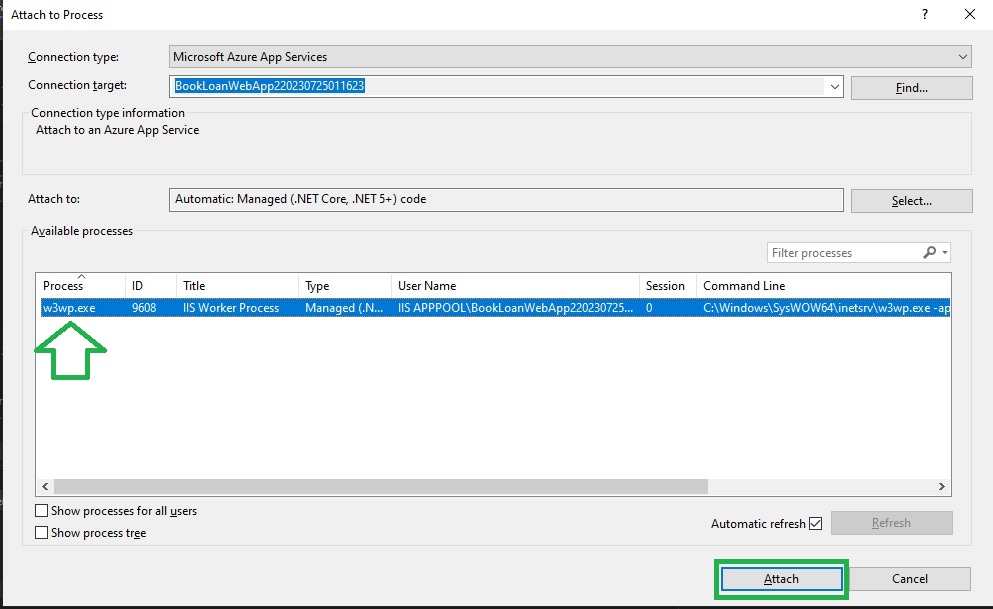
After clicking on the Attach button, your local application will attach to the remote Azure Web App instance. In the next section, I will show how to step through the application source in a remote debugging session.
Stepping through a Remote Debugging Session
Before I proceed to breakpoints, I want to show another feature of the remote debugging with the Just My Code option.
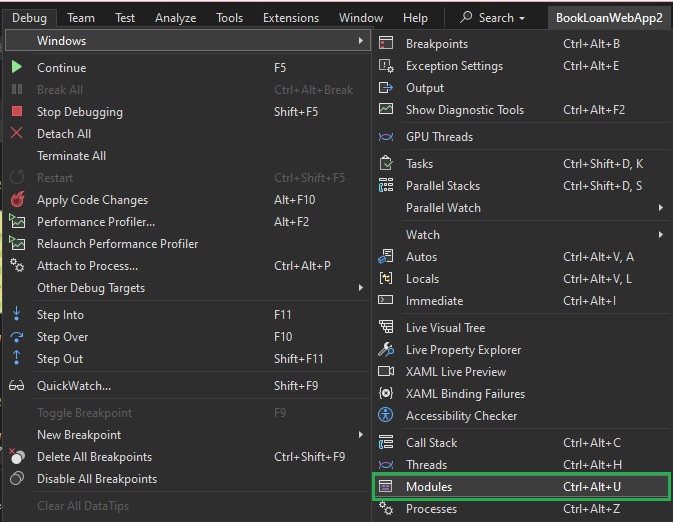
After attaching to the remote process, the list of running modules will be visible in the Modules menu item within the Debug | Windows menu.
After selection, you will see a list of loaded application modules. These consist of user modules and system modules. The user modules are those DLLs that contain the custom user code for the application.
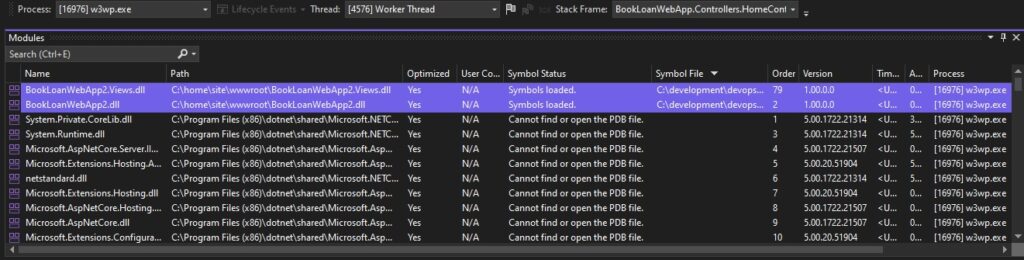
Looking closely at each module, you will notice that there are two different types of modules:
- Modules that have loaded symbols.
- Modules that have no loaded symbols.
The Just My Code debug option that I set earlier, will only load debug symbols for my user code. Code for system code will not be loaded.
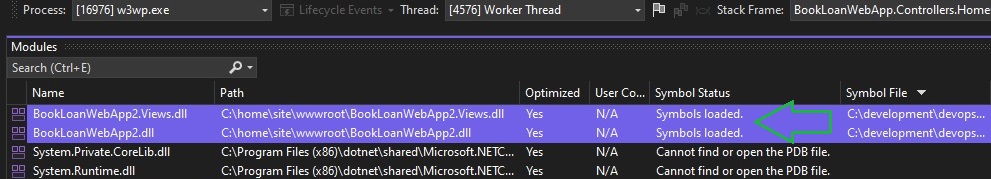
The column Symbol Status will display the text Symbols Loaded for user code libraries. In this case, symbols will be loaded for the ASP.NET Core libraries for the following DLLs:
[App Name].dll
[App Name].Views.dll The column Symbol File shows the debug symbol file that contains the debug information for the library module. The symbol file (also known as the debug symbol file), is in the projects \obj\Release\net5.0\ sub-folder and has a .PDB extension.
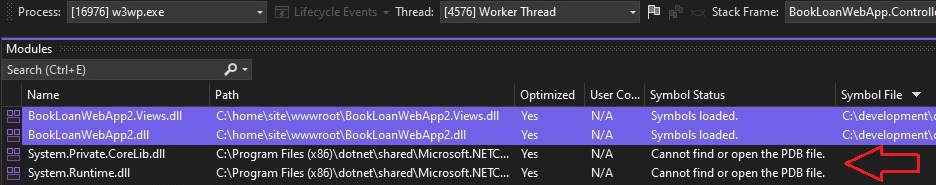
Module libraries that are not user code will not contain user debug symbols and will not have any associated symbol files. Examples of non-user modules include system libraries and framework libraries. Examples of non-user libraries include:
System.Private.CoreLib.dll
Microsoft.AspNetCore.dll
With non-user modules, the column Symbol Status will display Cannot find or open the PDB file. In this case, no symbols are be loaded.
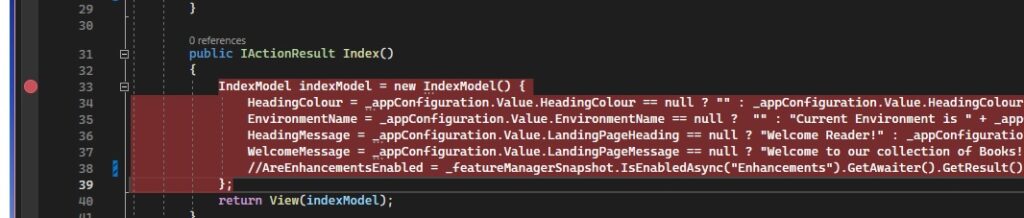
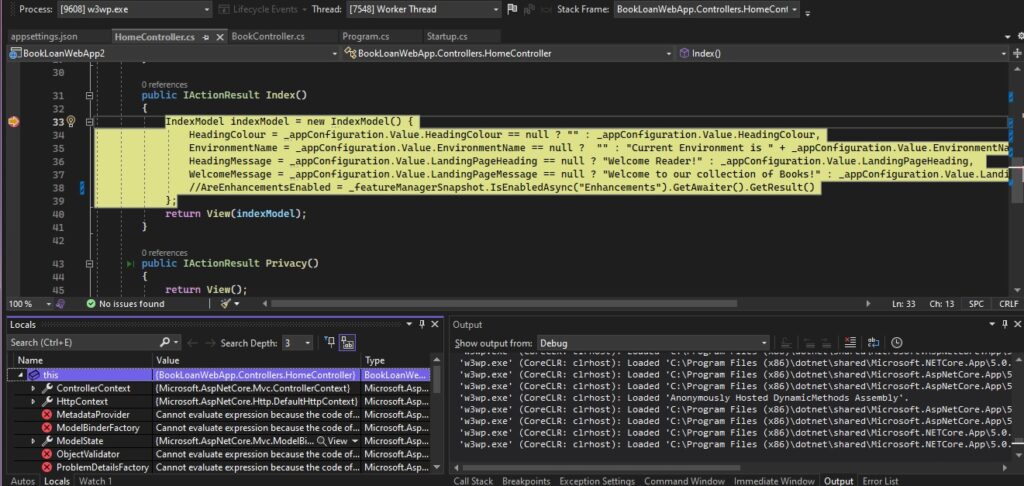
Next, create a breakpoint within the source of the ASP.NET web application.
At this point, there is no debug session running as we have not instantiated an instance of the Azure Web App. To instantiate the Azure Web App, we open it by opening the URL within a browser.

When the running application code reaches the source code of the corresponding breakpoint, the debug session will suspend the application with the breakpoint highlighted and variables able to be inspected.
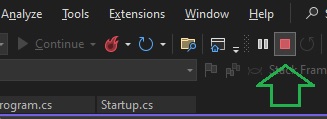
After we have completed our debugging session, we can end the debugging session by clicking on the red square stop button in the toolbar as shown:
We have seen how to setup and apply remote debugging for an ASP.NET Core web application from within Visual Studio 2022. This is a very useful tool we can use when we have deployed an ASP.NET Core web application to Azure and want to perform debugging scenarios that include resources and configurations within remote Web App instances hosted in Azure.
That is all for today’s post.
I hope you have found this post useful and informative.
Andrew Halil is a blogger, author and software developer with expertise of many areas in the information technology industry including full-stack web and native cloud based development, test driven development and Devops.