Welcome to today’s post.
In today’s post I will be showing how to profile the performance of .NET Core applications.
Most developers would be aware of application performance, but most would focus on performance only once an application encounters a bottleneck at some phase of the application. Even smaller applications of low complexity could be challenging, with high repetitions of loops containing calculations, or extensive use of memory allocations and deallocations all contribute towards degrading the performance of an application.
With applications that persist in memory for lengthy periods, the degradation of memory can result in memory fragmentation before the application is shutdown and memory is reclaimed. With applications, such as stateless API applications that persist in memory for shorter periods, the degradation of memory would be confined to the application pool of the hosting process, such as IIS. In these cases, a recycling of application pools would reclaim the memory, and would be considered an outage in a production environment.
In this post, I will provide some useful advice on the tools that are available in Visual Studio 2019 that allow you to diagnose performance and memory issues, then adjust the source accordingly to optimize memory use.
In a previous post I showed how to analyze memory usage within a .NET Core application. Both memory and performance analysis are recommended as part of a developer’s tool kit during the development and debugging of applications.
In the first section, I will show how to analyze memory usage during application debugging.
Analyzing Memory Usage
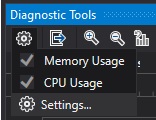
When analyzing memory usage in an application I introduced the use of the Diagnostics Window and the use of snapshots to capture the state of the application when debugging. By default, CPU usage is not enabled by default during debugging. To enable CPU usage select the Diagnostic Tools settings cogwheel menu and Settings..
In the property pages, select CPU Usage and Enable CPU Profiling as shown:
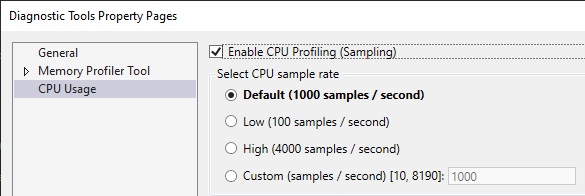
Apply changes to the configuration.
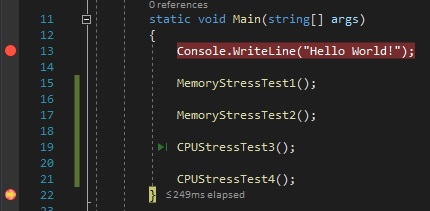
Set two breakpoints to the section of code you wish to analyze, preferably before and after the sections you wish to analyze. In the screenshot below we are analyzing the two methods, MemoryStressTest1() and MemoryStressTest2() as shown:
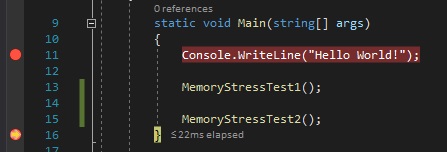
The above methods are the same methods using StringBuilder and string concatenations that I profiled in my previous post on memory profiling.
Run the application in debug mode.
Analyzing CPU Performance
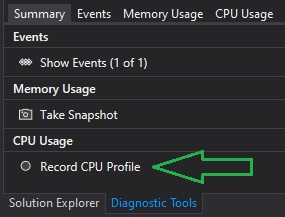
When the first breakpoint is hit, click on Record CPU Profile in the Diagnostic Tools’ Summary tab as shown:
To generate the CPU performance data, we run to the next breakpoint.
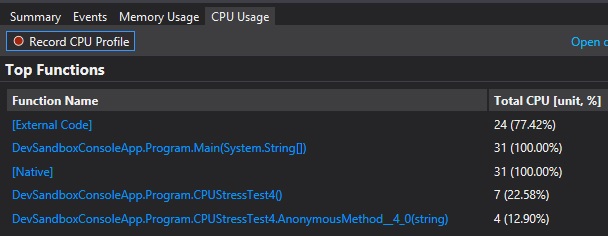
When the data has generated, the performance report will display in the CPU Usage tab as shown:
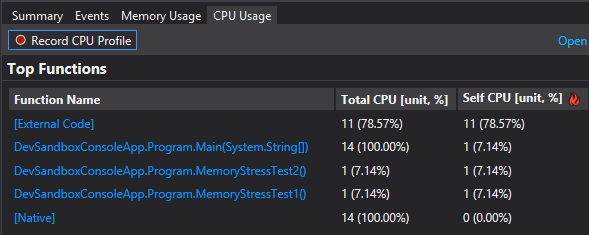
In this case, we can see both methods have run at precisely the same CPU % of 7.14%.
In the CPU session graph, the analyzed section in displayed as a yellow area.
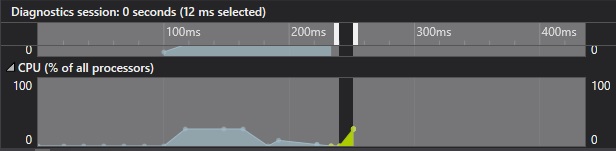
Click on the yellow area of the session graph. The CPU function view will show the section of code that has been analyzed:
From here we can drill down and show the method code block to review the source.
CPU Performance Comparison of Methods
Next, I will check the performance of two additional methods that do pretty much the same thing as the previous two methods, except we will use a list List<T> collection and an immutable list collection, ImmutableList<T> to store and output lists.
The method using a list collection is shown below:
static void CPUStressTest3()
{
    List<string> stringList = new List<string>();

    for (int i=0; i<100; i++)
    {
        stringList.Add($"String Number {i}." + Environment.NewLine);
    }

    for (int i = 0; i < 100; i++)
        Console.WriteLine(stringList[i]);
}
The method using an immutable list collection is shown below:
static void CPUStressTest4()
{
    ImmutableList<string> stringList = ImmutableList<string>.Empty;

    for (int i = 0; i < 100; i++)
    {
        stringList = stringList.Add($"String Number {i}." + Environment.NewLine);
    }

    stringList.ForEach(act =>
    {
        Console.WriteLine(act.ToString());
    });
}
Like we did for the previous CPU profile, run the application until it hits the initial breakpoint as shown:
Enable CPU profiling again (as it resets after each debug session).
Start CPU profiling in the Diagnostic Tool window.
Run to the next breakpoint, which is just after the final new method, CPUStressTest4().
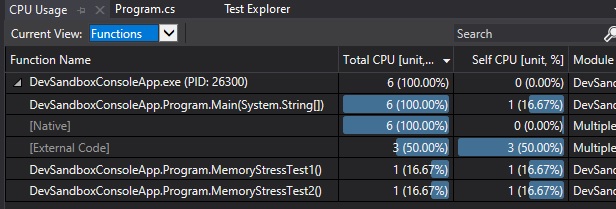
The CPU usage will show below:
Select the method from the function names. The detailed CPU Usage window will open:
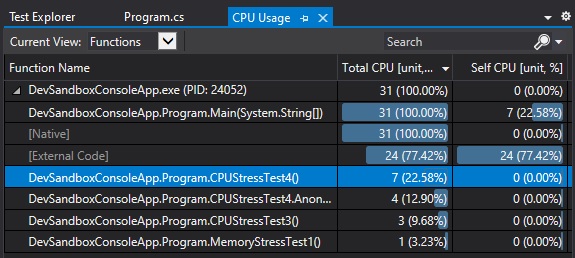
You can observe the CPU for the two new methods and compare the respective percentages.
Notice that the method using a List<string> collection has a CPU of 3 units (9.68%). The method using an ImmutableList<string> collection has a CPU of 7 units (22.58%).
Performance Comparison of Immutable versus Mutable Collections
If you are aware of the generic collections used in C#, then we know the List<T> collection is mutable and the equivalent immutable collection ImmutableList<T> append objects to their object instances differently.
With List collections, items are added in-place to the existing list structure by creating and linking one additional object instance to the end of the existing list. This operation updates the size of the original list instance.
With immutable List collections, items are added by copying the entire list into a new immutable List instance with the appended object. The original list is deallocated from memory and replaced with the new immutable list. This operation increases the length of the new immutable list by one.
We can see the immutable list is a more CPU intensive operation, which is not as performant as the mutable list. Where an immutable list is favorable is being thread-safe within a multi-threaded context.
We have seen how to use the Visual Studio 2019 diagnostic tools to help us identify and compare differences in CPU performance usage at different points during debugging, and when a significant CPU intensive operation has been completed. This allows us to compare different C# types and classes and determine which offer better CPU performance.
That is all for today’s post.
I hope you have found this post useful and informative.
Andrew Halil is a blogger, author and software developer with expertise of many areas in the information technology industry including full-stack web and native cloud based development, test driven development and Devops.