Welcome to today’s post.
In today’s post I will show how to log diagnostics information from your .NET Core application to an Azure App Service.
In a previous post, I showed how to add logging capability to a .NET Core application. The logging code that you use in an on-premises .NET Core application will be identical to that in an Azure hosted application. The difference between these is how we configure the logging within the Azure App Service that the web application is deployed to. I will show how we configure logging within the Azure App Service within the Azure Portal later.
I will also discuss how to optimize logging to account for Application Service Plan limits of cost and Storage Account limits.
With logging that occurs within an on-premises application, we can dump the log outputs to a file, a database, to a shared folder. We would also have to be conscious of the security permissions of the destination folder where we are creating or updating the log files. These are considerations that we will also be conscious of within the Azure environment, where there are in addition, Azure storage accounts that can be used to contain logs. The additional parameter of cost is included in the logging complexity. Adding log files and expanding logs file sizes within a folder within an Azure App Service web application is temporary, and not feasible as there are limitations in this before you are required to populate an existing Azure storage account with log data.
With standard .NET and ASP.NET applications that are written for in-premises web servers, there are identical levels of categorizing the logging levels. The same logging levels are applicable for applications hosted in the Azure cloud environment. I will explain these in the first section.
Explaining the Categories of Logging
Firstly, I will classify the levels categories of logging in the table below:
| Level | Categories |
| Disabled | None |
| Error | Error, Critical |
| Warning | Warning, Error, Critical |
| Information | Info, Warning, Error, Critical |
| Verbose | Trace, Debug, Info, Warning, Error, Critical |
The above levels of logging determine the frequency of logging and on which environment (development or production) we will output the log to. They also show the importance of the logging in the development phase, where Error logs are of higher importance in the production environment than Debug logs, which are common in development environments.
In the following table we show the frequency of logging associated with each category:
| Logging Category | Purpose | Logging Frequency |
| Trace | Debugging information. Sensitive information. | Very High. |
| Debug | Debugging information. Sensitive information. | High. |
| Information | Informative. Trace for application flow. Mainly for analysis purposes. | Often. |
| Warning | Includes non-critical errors. Application continues. Error may need investigation. | Occasional. |
| Error | Errors and exceptions that cannot be handled. Will require investigation. | Rare. |
| Critical | A critical failure. Requires immediate attention. | Very Rare. |
In development, the first two categories of logging, Trace and Debug are utilized quite often. Warning, Error, and Critical categories can be logged to the console. Trace, Debug and Information categories can be logged to a file.
In production, the Debug category should be disabled, and the next two categories, Trace and Information should be directed to a low cost, high capacity storage. Warning, Error, and Critical categories can be logged to a low or a high-volume data storage as the logs generated are infrequent.
Bearing in mind the above considerations, we can finetune our logging to optimize information output and storage costs in our cloud environment.
Capturing Basic Logging within an Application
I will assume that you already have an existing application that uses the logging middleware to provide for console and/or debug logging. More details on how logging is setup and injected into your application classes is explained in the previous post on logging that I referred to at the start of this post.
After implementation of logging in your application to capture errors like the one below in an exception block below:
catch (Exception ex)
{
   _logger.LogError(ex, "Error running book search filter {searchstring}", SearchString);
   ..
}
You can then, save, build, and deploy the application to Azure.
For the purposes of this logging exercise, you can induce an error by creating a try { … } catch { .. } block within your application and include a division by zero operation within the try block, with the error logged within the catch block.
You can then run the web application and induce the error by selecting the action that reaches your erroneous code block.
Note: Errors from a web application hosted in an Azure Application Service will not output logs into the file system! In fact, if you go into the Kudu console and the folder D:\home\site\wwwroot\LogFiles, there will be no custom logs written there.
In the next section I will show how to activate and capture logs into blob storage.
Activating and Capturing Logs into Blob Storage
As I mentioned, logs that are directed into the debug console in .NET Core applications do not automatically dump the log files into the /LogFiles folder within the /DebugConsole sub-folder within the deployed web application’s root folder.

Where have the logs be written to?
The answer is a file within a blob storage container within Azure storage.
To logging for your Application Service in Azure, select the App Service Logs option under Monitoring in your Application Service.

A screen full of options displays including these options:
- Application Logging (File System)
- Application Logging (Blob)
- Web Server Logging
Below are the foll complement of logging options that are available to you:

With the file system option, it will only be enabled for up to 12 hours, then it will be disabled.
This option is likely to possibly fill up the file storage space, so it is limited.
In the next section I will show how to configure blob logging and retention and storage.
Configuring Blob Logging Retention and Storage
With the application blob logging option, this is the option that is permitted long-term for the web application hosted within the Application Service.
Once the blob logging option is selected, then enter a retention period. Bear in mind your storage limits and type of storage used (LRS, GDS etc.). For an evaluation for basic plan, set this to 1. For production plans this can be in days.

Next, select a storage account to provision the blob file storage:

Next, save the logging settings for the Application Service.
Open the web site.
Induce the error.
Open the Azure Portal.
Open the Storage Account containing your blob.
Navigate to the blob container folder:

Select the blob container:
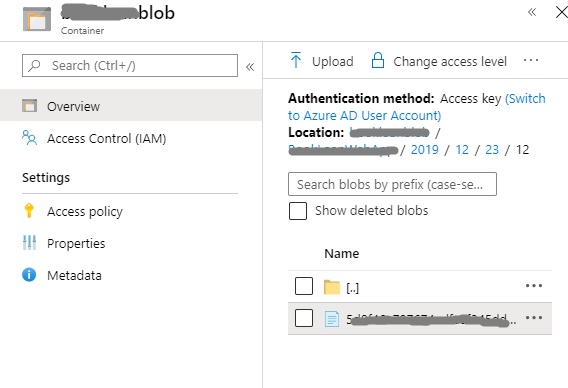
Open the Blob file.
There is a URL which can be copied and pasted into the browser to download the log file.

Once opened, the error message that your application has logged will show.
If you nominated a level of Error as per the logging configuration screen, then Application Service will filter this particular error level and dump it into the log file as shown:

In this post, you have seen how to take an existing .NET Core application that is deployed into an Azure App Service, then configure it for logging and storage. We have also learned how to review log data within an Azure storage account blob container.
That’s all for today’s post.
I hope this post has proved useful and informative.
Andrew Halil is a blogger, author and software developer with expertise of many areas in the information technology industry including full-stack web and native cloud based development, test driven development and Devops.