Welcome to today’s post.
In today’s post I will be discussing code coverage reporting and how it can be used within Visual Studio 2022.
In previous posts, I showed how to setup code test coverage within Angular applications. I also showed how to setup basic test coverage reporting within the Team City Continuous Integration and Build tool and more detailed test coverage reporting within Team City.
What is test coverage?
Test coverage is a quantitative measurement of the level of testing that your application has. It is a comparison of the number of methods and functions within any component compared against the number of corresponding unit tests.
In the next section I will explain how we provide code coverage in the Visual Studio development environment.
Code Coverage in Visual Studio
I will focus on explaining how to provide test code coverage for a basic ASP.NET Core web application with an NUnit test project. With Visual Studio 2022, the version you have installed determines the features you have available for development and testing. With the enterprise version of Visual Studio 2022, you will have code coverage reporting built into the test tools. With other editions, including the most popular community edition, there are no code coverage tools or reporting available. In this case we can make use of some useful third-party source code test coverage reporting tools (and free) that provide high quality reporting and are straightforward to use.
The code coverage tool I will be using is the Report Generator tool (https://reportgenerator.io/), which can be installed as a NuGet package or an extension within Azure Devops. I will show how to install it into Visual Studio and configure it for use in the development environment.
There are two NuGet packages that are required to use the code coverage reporting.
The first is the coverlet.collector package, which collects the code coverage of each line of code within the projects within your solution and generate a Cobertura formatted XML file, coverage.cobertura.xml, which provides the data for the code coverage report generator.

The next package if the ReportGenerator package, which reads in the Cobertura code coverage XML data file as input, then generates as outputs, the HTML files in a user-friendly report in a separate folder.

Once installed, the report generator tool is located within the user profile sub-directory of the NuGet package, which is like:
$(UserProfile)\.nuget\packages\reportgenerator\[version]\tools\[dor net version\Instead of having to run the report generator from the user-profile sub-directory, we can install the report generator as a global .NET tool. We do this with the command-line as shown:
dotnet tool install -g dotnet-reportgenerator-globaltool
Once that is installed, we can run the report generator tool from any folder as a command to generate the final HTML output for the code coverage of our projects.
In the project folder of one of our test projects or even in the solution folder we can run the commands to generate the code coverage XML data file and final HTML coverage report.

In the next section, I will show how to generate code coverage output files.
Generation of Code Coverage Files
To generate the code coverage XML data file, we can either run the following command either against our solution, which many have multiple test projects, or against an individual test project:
Generating the code coverage data file from our solution is done with the command as shown:
dotnet test ../../BookLoanWebApp.sln --collect:"XPlat Code Coverage"
Generating the code coverage data file from a test project is done with the command as shown:
dotnet test BookLoanWebAppTests.csproj --collect:"XPlat Code Coverage"
There are situations where you may not want to generate the code coverage directly from the solution, as it may have more than one test project and some of these tests may include end-to-end tests that run interactive browser sessions and the coverage reporting would make less sense.
The above commands will output the XML data file into a sub-folder, \TestResults within the same folder that we run the command.
We will also need to clear (delete) the results files and GUID sub-folders from the destination folder, we do this with the following batch (.bat) script:
SET cdvar=%cd%
RMDIR "%cdvar%\TestResults\" /s
dotnet test BookLoanWebAppTests.csproj --collect:"XPlat Code Coverage"
Typical output of the XML coverage data file generation is shown below:

More details on the dotnet test command usage is found on the Microsoft learn site (https://learn.microsoft.com/en-us/dotnet/core/tools/dotnet-test).
In the next section, I will show how to generate code coverage reports.
Generation of the Code Coverage Report
To generate the final HTML coverage report, we can use the following batch (.bat) script:
SET cdvar=%cd%
reportgenerator -reports:"%cdvar%\TestResults\**\coverage.cobertura.xml" -targetdir:"coveragereport" -reporttypes:Html
The above gets the current directory, then runs the report generator to retrieve the XML input coverage data file from within the \TestResults\ sub-folder. It does this with a recursive wildcard match on the coverage.cobertura.xml file. It then outputs the report in HTML format to the coveragereport sub-folder.

Typical command line output is shown below:

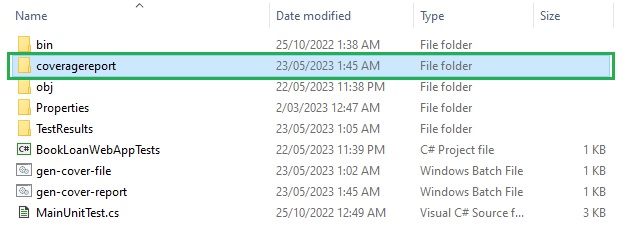
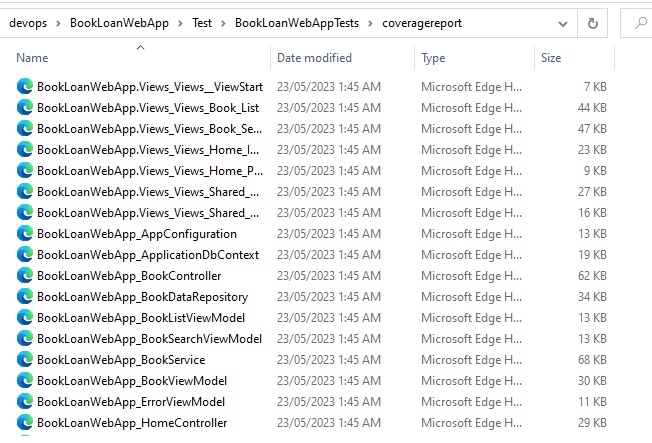
The resulting HTML output of the coverage report files is shown below:

There will be one HTML report file generated for each source code file.
Opening the HTML coverage report is done by opening the index.html or index.htm file in the /coveragereport subfolder.
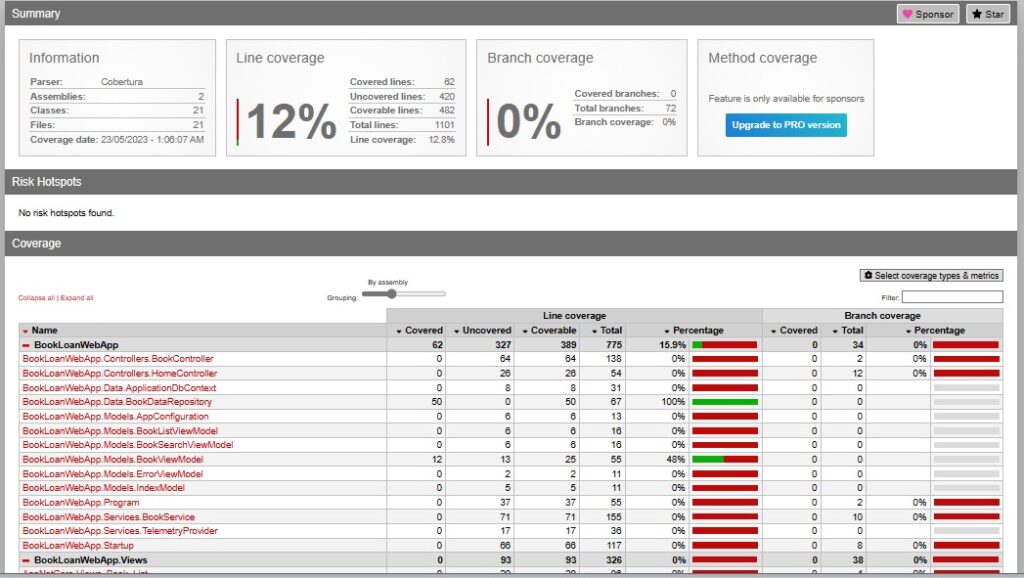
I have tried opening the report using the Edge and Chrome browsers. When opened the landing page of the coverage report will look like this:

You will notice the following statistics in the header section:
- line coverage percentage
- branch coverage percentage
For method coverage percentage, this is available in the Pro version of the product.
In the detail grid section, you will see a breakdown of each source file with the following coverage statistics:
- lines covered.
- lines uncovered.
- total lines coverable.
- total possible lines.
- percentage of code coverage (covered out of coverable).
When we click on one of the source links, a summary report outlining the statistics from the detail grid will show:

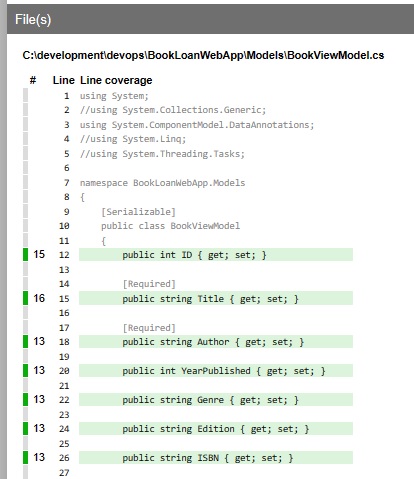
When we click on the red file hyperlink, a line-by-line display will show the lines that have test code coverage are covered in green:

Source code lines that do not have test code coverage and are uncovered are shown in red:

As you can see, we can generate high quality code test coverage reports for our solution using a tool which is straightforward to install and use.
In a future post, I will show how to use report generator tool within an Azure DevOps pipeline.
That is all for today’s post.
I hope you have found this post useful and informative.
Andrew Halil is a blogger, author and software developer with expertise of many areas in the information technology industry including full-stack web and native cloud based development, test driven development and Devops.


