Welcome to today’s post.
In today’s post I will discuss how to install code coverage reporting extensions, the integrate and generate source code coverage reports into an Azure DevOps build pipeline. I will also show how to display the coverage report within the pipeline build summary.
In a previous post, I showed how to generate and integrate code coverage reports of an ASP.NET Core web application within Visual Studio 2022. I will build on that post by showing how to use the same code coverage report generation within an Azure DevOps build pipeline.
The alternative approach to integrating code coverage reports within Azure DevOps is to use a cloud based or hosted server approach to store the reports and access them there through a separate external link. An example of a code coverage tool that uses a cloud or hosted server are the SonarCloud (cloud based) or SonarQube (hosted server) tools. With these tools, we integrate the external code coverage and quality scanning service with our Azure DevOps build pipeline, and the output from the generated analysis is uploaded to the Sonar cloud (or hosted server) service, where they are available as visible reports.
In the next section, I will show how we can use an Azure DevOps marketplace extension to generate HTML reports code coverage reports.
Using a Report Generation Extension Tool
From within Azure DevOps extensions marketplace, there are some useful tools that can generate reports into readable HTML reports that can be opened and allow the developer or QA engineer to drill down into each listed source file and determine the extent of code coverage.
Continuing from my previous post, I will use the Azure DevOps equivalent of the ReportGenerator tool that can provide these HTML code coverage reports. Screenshot below shows the introductory tile for the extension.
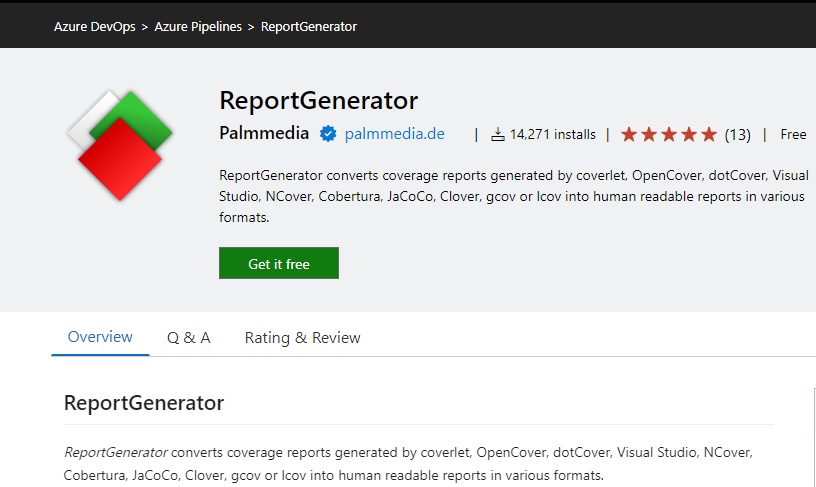
The extension tool is free for the basic features such as:
- Code coverage percentage.
- Branch coverage.
Module code coverage is a premium feature, which is available on a pro license.
In the next section, I will show how to configure the code coverage report generation tool within the build pipeline.
Configuration of the Report Generation Tool in the Build Pipeline
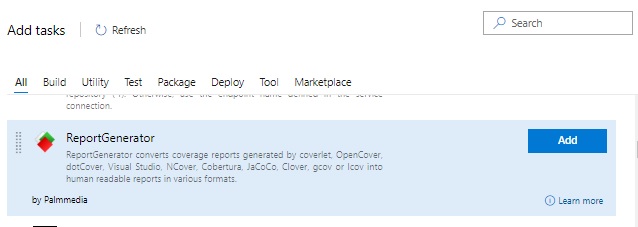
Integrating a report generation task is straightforward, and can be done by adding the task to the build pipeline as shown:
You will see some default parameters in the task definition as shown. Below is the task with folders locations set for Reports and Target directory:
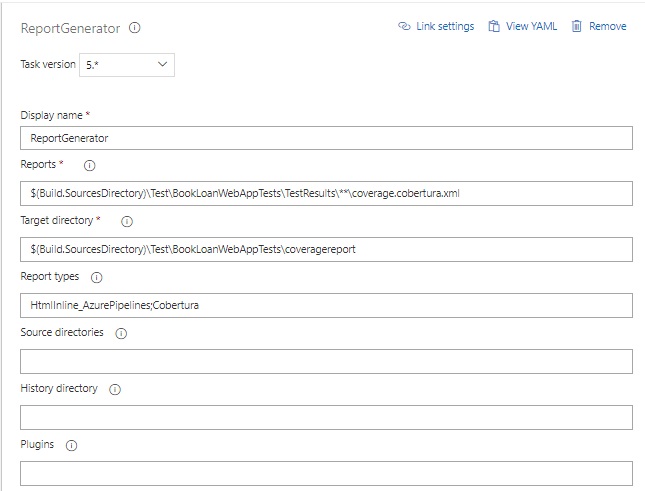
The task essentially is the command line equivalent that we ran within the Visual Studio environment to generate the code coverage into an output report folder.
The parameters for the above task, which were set are shown below:
Reports: $(Build.SourcesDirectory)\Test\BookLoanWebAppTests\TestResults\**\coverage.cobertura.xml
Target directory:
$(Build.SourcesDirectory)\Test\BookLoanWebAppTests\coveragereport
The above parameters reference the identical sub-folders we had in the test project for the code coverage XML data file, and the code coverage HTML output reports.
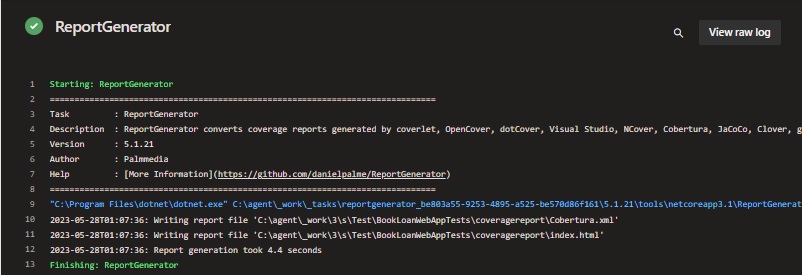
Below is a log of a sample run of the task:
We then include another Publish code coverage task further down our pipeline, which will take the contents of the generated HTML code coverage report folder in TestResults, then copy it over into an artifact published folder. Below is the task with folders locations set for Summary file and Report directory:
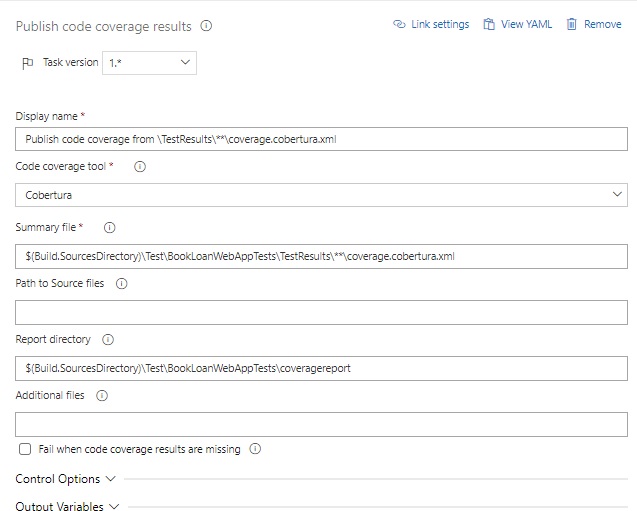
The parameters for the above task, which were set are shown below:
Summary file: $(Build.SourcesDirectory)\Test\BookLoanWebAppTests\TestResults\**\coverage.cobertura.xml
Report directory:
$(Build.SourcesDirectory)\Test\BookLoanWebAppTests\coveragereport
In the next section, I will show hoe a sample pipeline execution runs looks, where the generated coverage artifacts reports are and how the generated coverage reports look.
Execution of the Build Pipeline and Reviewing Generated Coverage Reports
They are identical folder locations to those we had for the ReportGenerator task.
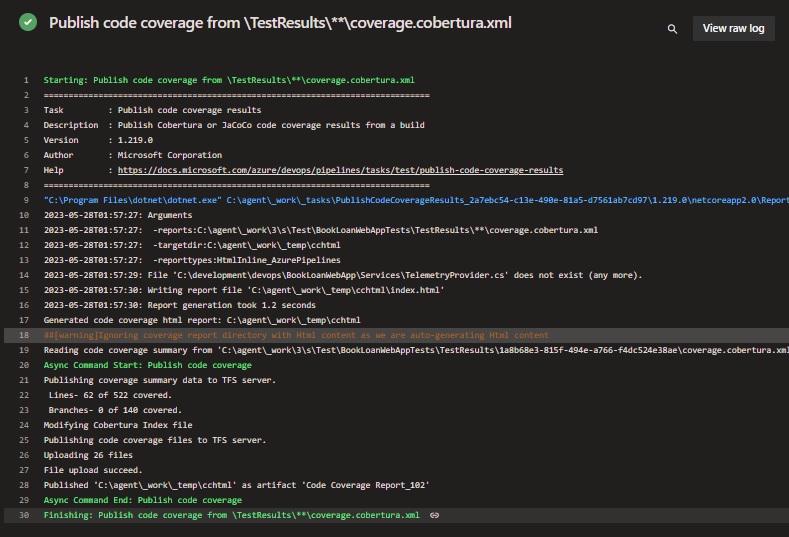
Below is a log of a sample run of the task:
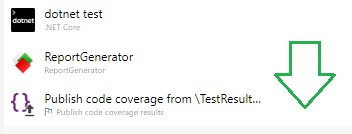
In our build pipeline, the ordering of the above coverage two report tasks should be in the following order:
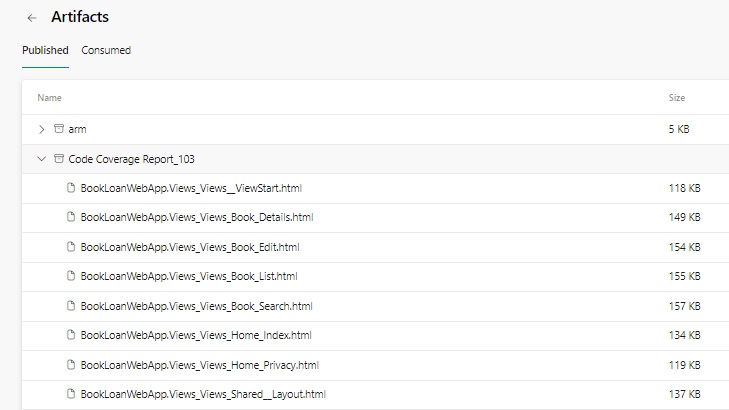
When the code coverage report HTML files are published, they will be created within the artifacts folder shown below:
To avoid regeneration of the Microsoft code coverage reports in the pipeline, set the following environment variable as shown:
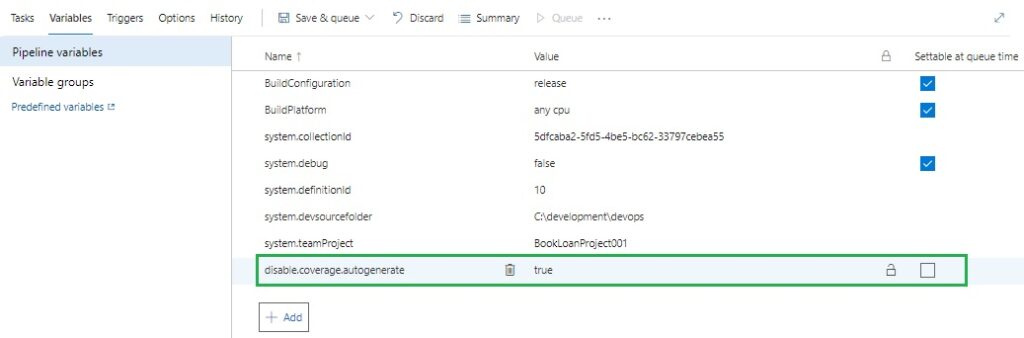
When the build completes, the code coverage summary will be displayed in the Code Coverage tab in the pipeline build summary as shown:

Notice that there is no tab or link to the HTML code coverage reports.
To make these HTML code coverage reports visible within the pipeline build summary, we can try the following.
There are some useful Azure DevOps Marketplace extensions that can include the generated HTML reports in the build pipeline. Once such tool is the one shown below:
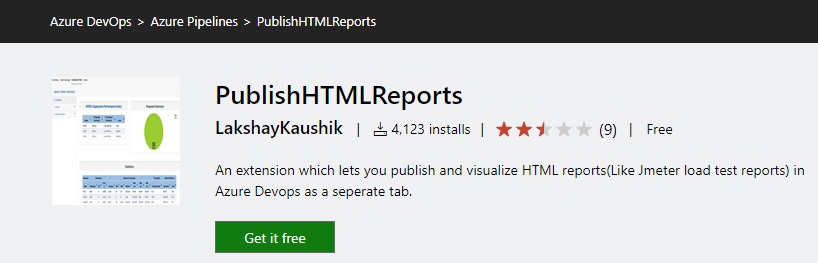
We add the extension to our build pipeline as shown:

We then move the above task after the above two code coverage reporting tasks.
The task definition to publish the HTML report is shown below:
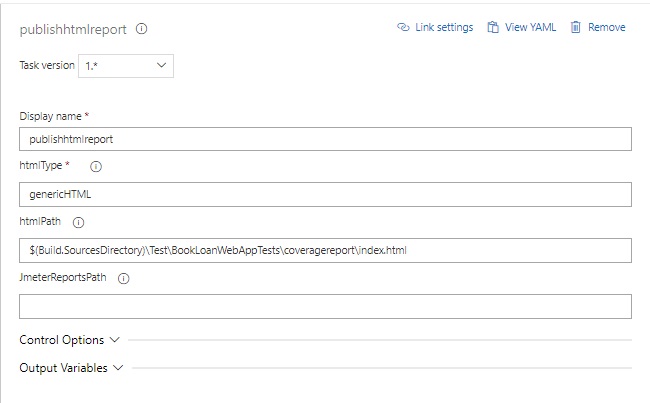
The task parameter for htmlPath, which is: $(Build.SourcesDirectory)\Test\BookLoanWebAppTests\coveragereport\index.html
The HTML path of the above parameter is the landing (index) page of the generated coverage reports.
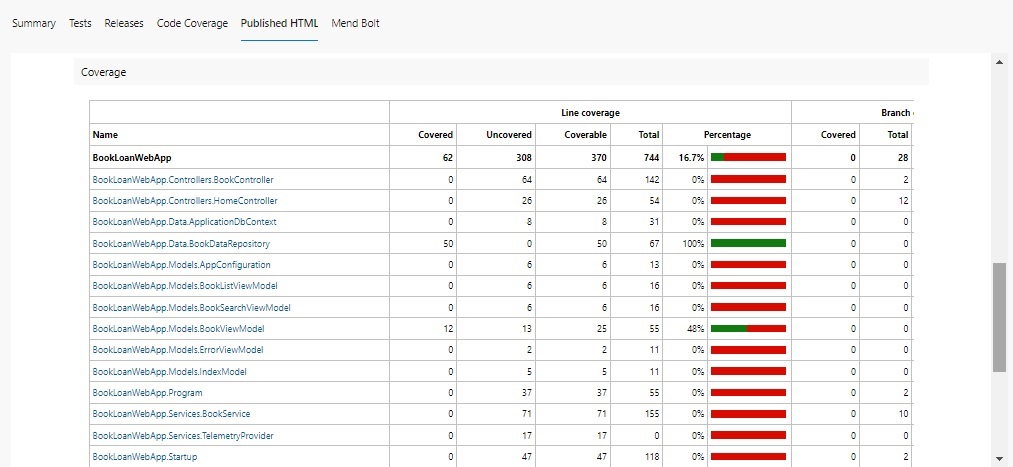
After the above task completes within the pipeline build, an additional tab will show in the build summary, with the HTML displaying as shown:
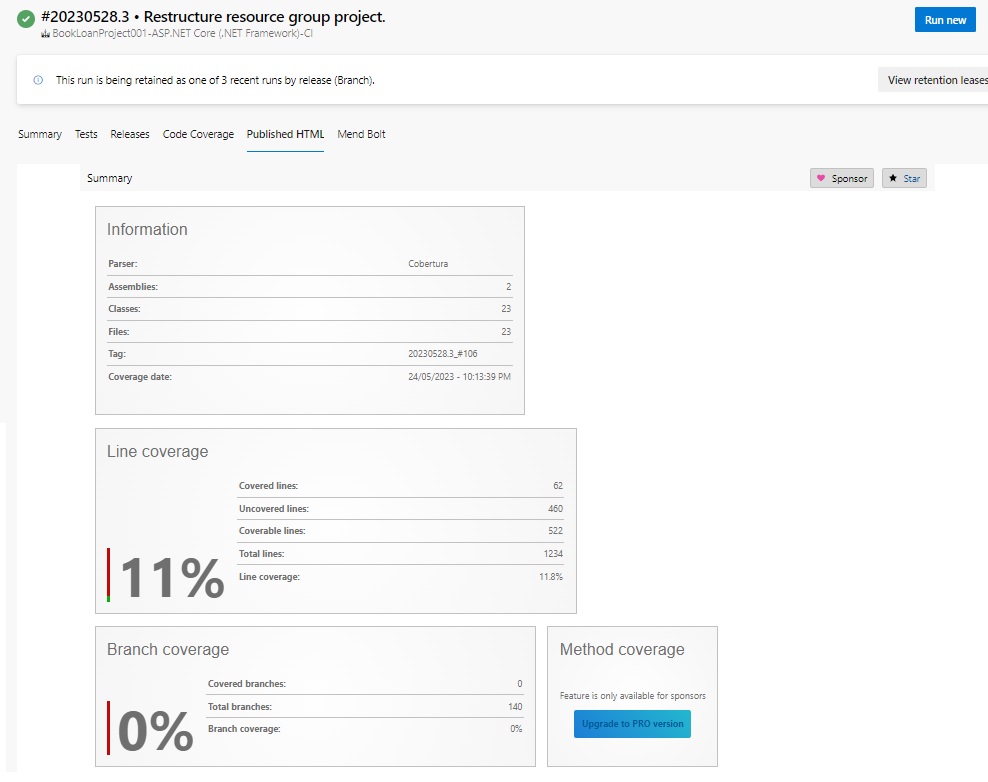
When we scroll further, we will see the coverage for each source file:
As we can see from the above, we have managed to successfully integrate code coverage reports into our Azure DevOps pipeline using some useful Marketplace extension tools.
Currently, there is no built-in tool out of the Azure DevOps pipeline task palette that permits the code coverage reports to be displayed in the pipeline build summary tabs. In this case, we have used some very useful extension tasks to provide this.
I have not been able to find a way to reference the location of the artifacts folder that the HTML coverage reports were published to from the pipeline build summary tab. Perhaps the folder is uploaded elsewhere on the build server. This would be another location from where we could view the published HTML reports.
In future posts I will be investigating other useful ways in which we can use extension tools within Azure DevOps pipeline builds.
That is all for today’s post. I hope you have found this post useful and informative.
Andrew Halil is a blogger, author and software developer with expertise of many areas in the information technology industry including full-stack web and native cloud based development, test driven development and Devops.