
Welcome to today’s post.
I will discuss how to setup interactive debugging of your Angular application within Visual Studio Code.
With most browsers including Firefox and Chrome that support JavaScript, you can configure debugging by enabling script debugging, which can help when developing cross-browser functionality. In this post, I will be discussing how we can, using the Visual Studio Code IDE, configure it to support Chrome debugging.
In Chrome there is already a feature that allows you to open the JavaScript source for your NPM Webpack built application and set breakpoints. This is not the most user-friendly interface to debug your angular application as you are required to locate the target source code at the start of each debug session, which can be time consuming. I will show how to install, configure, and run a basic debug session using Visual Studio Code.
Setup Debugging with the Chrome Debugger Extension
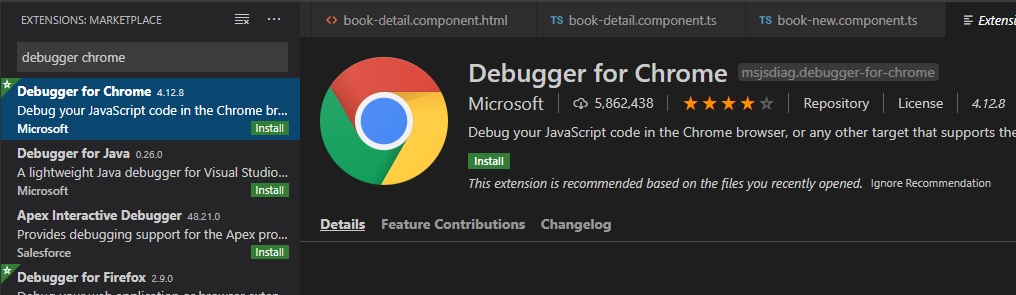
To debug within Visual Studio Code will require the Chrome Debugger extension.

Once the extension is found, install it.
Next build the application using ng build:

Next, run the application using ng serve:
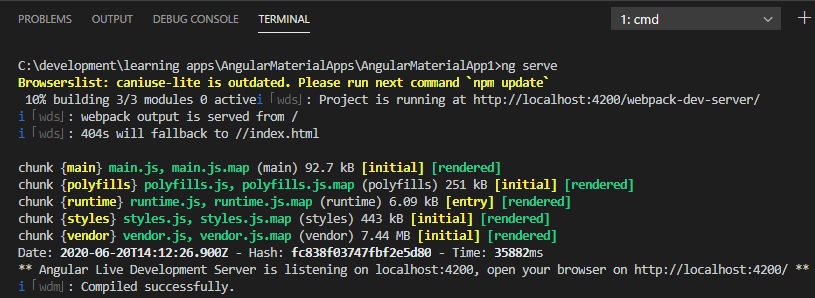
Once the application server is running you can run the Chrome browser under the debugging context:

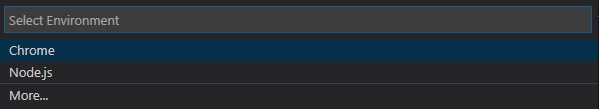
If you have not run the debugger before, you will be presented with some launch options. Select Chrome:
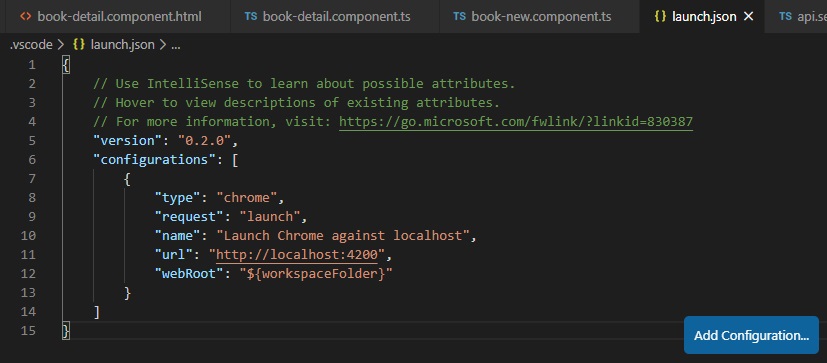
In the launch.json configuration file use port 4200 and save:
In the next section I will show how to debug an Angular application with Visual Studio Code.
Debugging an Angular Application with Visual Studio Code
In this section I will briefly go over how you can debug Angular applications with the interactive debugger that is possible with the Chrome Debugger Extension.
First, I will show how to start a debugging session within an application. There are two ways to run an Angular application within the Visual Code IDE.
The first way is to start an application in debug mode by pressing the F5 key.
Alternatively, to run an application without debugging, we can also press the Ctrl key with the F5 key to start the application without loading debug symbols.
Once the application runs in debug mode, you can then set a breakpoint to an accessible line of Typescript code in one of two ways:
- The first method is by double-clicking on the left of the line number as shown:

A round solid red dot will then appear to the left of the corresponding line number.
2. The second method is by pressing the F9 key. This will add a break point to the current line. To remove the breakpoint, simply press F9 again.
After we hit a breakpoint within the IDE, from this point on, we can navigate to debug subsequent lines of code in the same code block by pressing the F10 key. We can move from the first line indicated in the screenshot below onto the next line until we reach the end of the current block:

To move to a function or method that is called within the current block or scope, we use the F11 key.
As we can see in the screenshot below, we can advance the debug block scope from the onSelect() method into the first line of code within the getPagedView() method as shown:

In our application we set a breakpoint within the login method and within the authentication service component. The screen shows us in the login screen before we have hit any debug breakpoints:

After submitting our login form, we see our Chrome browser freeze.
Do not be alarmed! Our code has hit the breakpoint we set in the Visual Studio Code IDE.

Go back to the Visual Studio Code IDE and select the Debug Icon as shown below from the side bar:

You will see any active breakpoints shown in the breakpoint section near the bottom left of the IDE:

Now open the source file with the breakpoint and step into the code using F10 (step over), F11 (step into) and add watch expressions as desired.
To output information to our debug console, we can use the logging methods:
Console.log(“..”);

Console.error(“”);
The debugger console will then display useful logging information:

You can see how straightforward it was for us to install, configure and use rich debugging features to interactively debug our Angular web application using the Chrome debugger extension.
That’s all for today’s post.
I hope you found this post useful and informative.
Andrew Halil is a blogger, author and software developer with expertise of many areas in the information technology industry including full-stack web and native cloud based development, test driven development and Devops.

