Welcome to today’s post.
In today’s post I will discuss how Application Insights can be used within your ASP.NET Core web application. I will also show how to embed custom Telemetry within your application to allow you to collect data for measuring trends of different application events.
Telemetry is the gathering of data points (measurements) from a source, sending it to a remote location, then monitoring and analyzing the data.
The purpose of application telemetry doesn’t just cover application metrics, but also application logging and application events. The analysis of telemetry focuses on the measurement of events, metrics, and logs of a running application.
With Application Insights Monitor, we can chart metrics that would include web API requests of the application, or even the CPU usage or memory usage of the server hosting the web application.
With metrics, the most important aspect is the analysis of variations and trends of the collected data points yielding interesting statistical charts. In the case of application metrics, the analysis of individually collected measurements in most cases are not particularly interesting. Where the collection of individual data points might be of value is where we use telemetry to analyze application support issues in application logs.
Another aspect with the collection of custom application metrics is to determine which features of an application are used, mode of input (keyboard or mouse), device type (mobile, browser, or tablet) and how often they are used. With this information, a determination can be made on which application features may be improved in future releases, or features that could be scaled back or phased out for an alternative.
In the first section, I will show how to setup Application Insights within an ASP.NET Core web application.
Setup of Application Insights within a .NET Core Web Application
I this section I will explain how to setup Application Insights within a .NET Core web application. We will first need to install the NuGet package,
Microsoft.ApplicationInsights.AspNetCore
Next, you will need to add the following key and value pairs within the appSettings.json configuration file:
{
    …
    "ApplicationInsights": {
        "ConnectionString": "Copy connection string from the Application Insights resource in the Azure Portal"
    }
}
The connection string contains an instrumentation key, which allows collection of telemetry and logs from the application, and endpoints that refer to the application insights and diagnostics. Before we can make use of the connection string, we will require an Application Insights resource to be created within Azure.
Next, I will show how to install and setup an Application Insights resource in the Azure Portal.
In the Azure Portal, search for the “Application Insights” resource within the Azure Marketplace.
When selected, the resource creation page will open as shown:
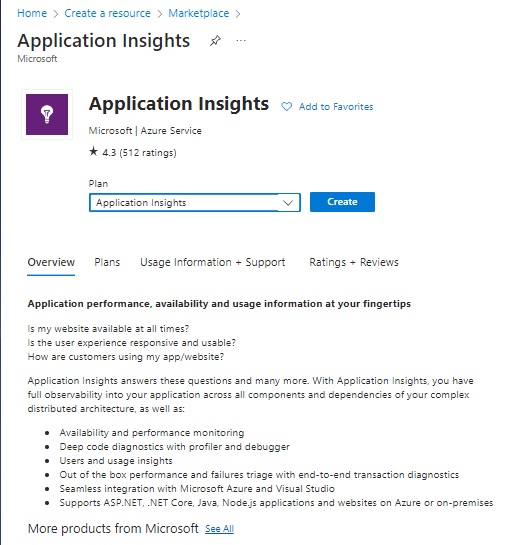
Creating the resource for Application Insights requires a subscription, resource group, name, region, and workspace details.

Once created, the overview page will show charts which include Failed requests, Server response time, Server requests, and Availability.
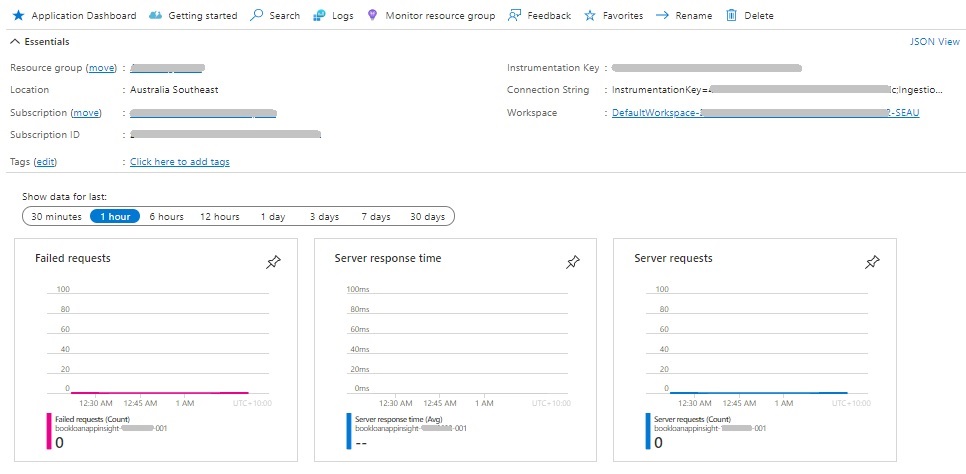
We can then copy the Connection String in the resource overview and paste it into the Connection String value within our appSettings.json file.
Next, I will show to configure the application startup to add the application insights service to the application service collection.
In the Startup.cs source file, within the ConfigureServices() method we enable application insights telemetry are follows:
public void ConfigureServices(IServiceCollection services)
{
    // Enable the Application Insights telemetry collection service.
    services.AddApplicationInsightsTelemetry();
    …
}
The above will read configuration settings from the appSettings file.
In ConfigureServices() method, we can also override the configuration settings within appSettings by passing an instance of ApplicationInsightsServiceOptions into the AddApplicationInsightsTelemetry() extension method as shown:
public void ConfigureServices(IServiceCollection services)
{
    Microsoft.ApplicationInsights.AspNetCore.Extensions.ApplicationInsightsServiceOptions aiOptions
= new Microsoft.ApplicationInsights.AspNetCore.Extensions.ApplicationInsightsServiceOptions();

    // Disabling the adaptive sampling.
    aiOptions.EnableAdaptiveSampling = false;

    services.AddApplicationInsightsTelemetry(aiOptions);
}
The above will use the configuration keys values under the key “ApplicationInsights”. The remaining settings are defaulted and are overridden. The EnableAdaptiveSampling option is enabled by default.
When the telemetry service is enabled, the telemetry client instance will have the connection string and instrumentation key populated with the settings values as shown:

In the next section, I will show how to examine telemetry during application execution.
Examining Telemetry During an Application Execution
In this section I will show how we can analyse telemetry during an application execution.
When the application runs, default metrics will show up in the Application Insights resource overview. These include Failed requests, Server response time, Server requests and Availability.

After navigating the home page and books list pages, the HTTP requests Home/Index and Book/List show with the duration and request count when we drill down into the server requests:
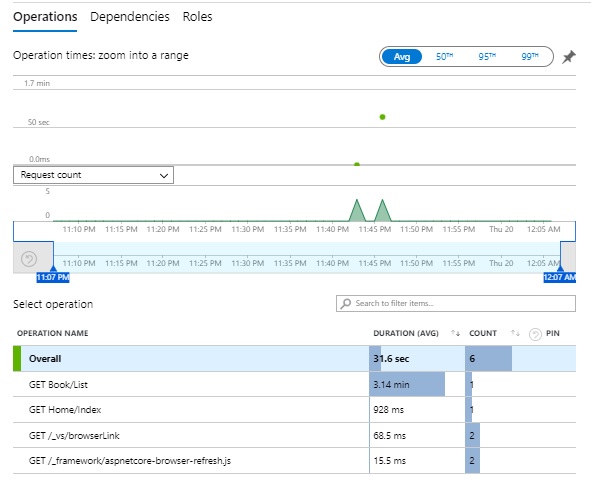
The application debug logs show telemetry request traces. The one below is for the books list request:
Application Insights Telemetry:
{
    "name":"AppRequests",
    "time":"2023-04-19T12:56:27.5772883Z",
    "tags":
    {
        …
        "ai.operation.name":"GET Book/List",
        …
    },
    "data":
    {
        "baseType":"RequestData",
        "baseData":
        {
            "ver":2,
            "id":"2a68b0f2b9d57047",
            "name":"GET Book/List",
            "duration":"00:00:02.4059412",
            "success":true,
            "responseCode":"200",
            "url":"https://localhost:44373/Book/List",
            "properties":
            {
                "_MS.ProcessedByMetricExtractors":"(Name:'Requests', Ver:'1.1')",
                "DeveloperMode":"true",
                "AspNetCoreEnvironment":"Development"
            }
        }
    }
}
In the next section, I will explain what Application Insights telemetry SDK commands are used to collect custom metrics data points.
Commands used to collect Data Points for Custom Metrics
I will now show how to collect custom telemetry by embedding some telemetry commands within the web controllers to send application metrics back to the application insights resource.
Azure Monitor Application Insights has two main ways of collecting metrics data from the application source. One method is non-aggregated, and the other method is aggregated. With the non-aggregated method, we collect more data points within each time interval and provide more detailed (accurate) reporting. With the aggregated method, we collect only a sample (an aggregation) of data points. Where the aggregated has an advantage is with lower storage usage and costs.
Each web request in a short time interval can send back many data points to the Application Insights resource. When the data points are the same value, this can be wasteful with little variation within the reporting time interval. In this case, it makes sense to send back aggregated data points. With aggregated data points, we have the benefit of lower storage costs and repeated data points aggregated within the reporting interval.
In the Azure Monitor Application Insights SDK there are two common commands used, TrackMetric() and GetMetric(). The command that is preferred, that collects aggregated data points is GetMetric(). What GetMetric() then does is to aggregate the data points once every minute before sending of summary (an average of) of the data back to Azure Insights Monitor resource for analysis.
In the next section, I will show how to configure the application web controllers to integrate telemetry.
Configuration of Web Controllers for Telemetry
I will first show how to inject the Azure Insights telemetry instance into a web application controller.
Below is the Home controller and the injection of the telemetry instance through the constructor:
using Microsoft.ApplicationInsights;

public class HomeController : Controller
{
    private TelemetryClient _telemetry;

    public HomeController(TelemetryClient telemetry)
    {
        this._telemetry = telemetry;
    }

    public IActionResult Index()
    {
    …
    }
    …
}
In the Index controller method, we can make a call to send a data point for the custom metric “HomePageRequested” with a value of 1:
public IActionResult Index()
{
    telemetryClient.GetMetric("HomePageRequested").TrackValue(1);
    return View();
}
In the Books controller, we can similarly add code to sample data for the custom metric “BookListings” in the List() method, and custom metric “BookSearch” in the Search() method. The difference between them is that in the search method, I send back a value that equals the size of the search result.
// GET: BookController
public ActionResult List()
{
    BookListViewModel bookListView = new BookListViewModel()
    {
        ListHeading = "Book List!!",
        BookList = new BookDataRepository().List()
    };

    _telemetryClient.GetMetric("BookListings"),TrackValue(1);

    return View("List", bookListView);
}


public ActionResult Search(string searchText)
{
    List<BookViewModel> bookList = new BookDataRepository().List();

    if (!String.IsNullOrEmpty(searchText))
    {
        bookList = bookList.Where(b => b.Title!.Contains(searchText)).ToList();
    }

    BookSearchViewModel bookSearchView = new BookSearchViewModel()
    {
        SearchResultList = bookList
    };

    int numberOfBooksFound = bookList.Count();

    _telemetryClient.GetMetric("BookSearch").TrackValue(numberOfBooksFound);

    return View(bookSearchView);
}
Below is a sample search screen that we have traced with the custom metric “BookSearch”.
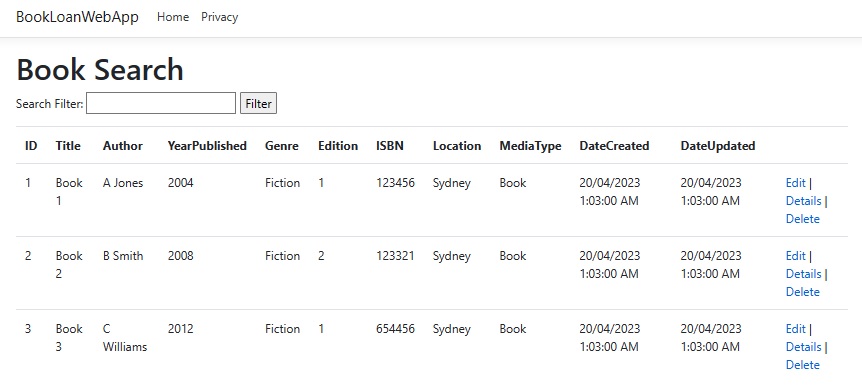
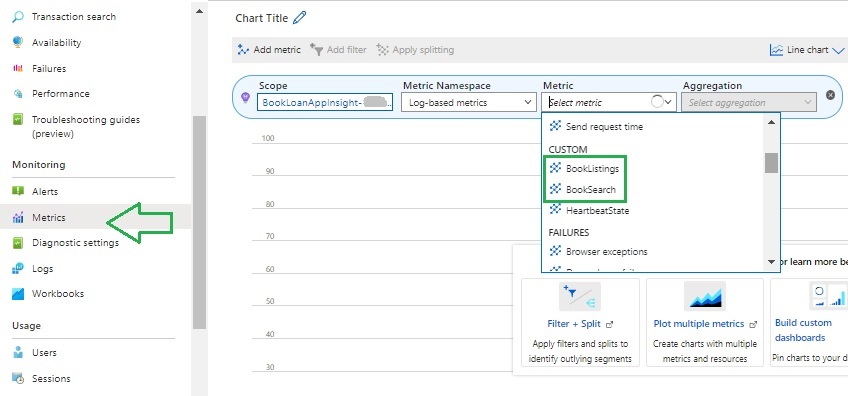
After running a sample search that yields three records, return to the Azure Insights resource overview, then select Metrics under the Monitor menu. In the default metric filter, select Log-based metrics under Metric Namespace. Under the Metric drop-down list scroll down until you can find the custom metrics that you have send data points for within the application:
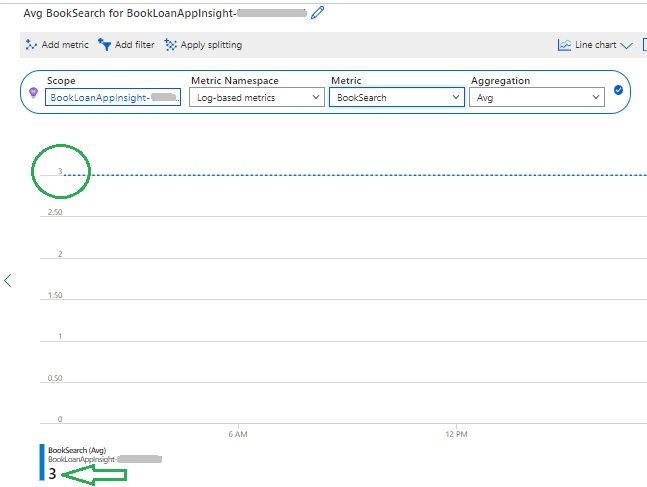
Selecting each metric one in turn will show us the time-based graph with the count of the data point. Below is the graph for the BookListings custom metric, which shows a value of 1.

Below is the graph for the BookSearch custom metric, which shows a value of 3.
In the application debug log, the custom metric “BookListing” log data below shows one data point, with a maximum value of 1, minimum value of 1, and count of 1 for the number of data points sampled.
Application Insights Telemetry:
{
    "name":"AppMetrics",
    "time":"2023-04-19T14:56:18.0000000Z",
    "iKey":"xxxx",
    "tags":
    {
        …
    },
    "data":
    {
        "baseType":"MetricData",
        "baseData":
        {
            "ver":2,
            "metrics": [
            {
                "name":"BookListings",
                "kind":"Aggregation",
                "value":1,
                "count":1,
                "min":1,
                "max":1,
                "stdDev":0
            }
            ],
            "properties":
            {
                "DeveloperMode":"true",
                "AspNetCoreEnvironment":"Development",
                "_MS.AggregationIntervalMs":"43000"
            }
        }
    }
}
In the application debug log, the custom metric “BookSearch” log data below shows one data point, with a maximum value of 3, minimum value of 3, and count of 2 for the number of data points sampled.
Application Insights Telemetry:
{
    "name":"AppMetrics",
    "time":"2023-04-19T15:02:01.0000000Z",
    "iKey":"xxxxxxxxx",
    "tags":
    {
        …
    },
    "data":
    {
        "baseType":"MetricData",
        "baseData":
        {
            "ver":2,
            "metrics":
            [
                {
                    "name":"BookSearch",
                    "kind":"Aggregation",
                    "value":6,
                    "count":2,
                    "min":3,
                    "max":3,
                    "stdDev":0
                }
            ],
            "properties":
            {
                "DeveloperMode":"true",
                "AspNetCoreEnvironment":"Development",
                "_MS.AggregationIntervalMs":"60000"
            }
        }
    }
}
The average values of each of the custom metrics corresponded to the values we observed within the Azure Insights Monitor metrics resource graphs.
What we have seen in this post are the following tasks:
- How to install Application Insights into a .NET Core web application.
- Install an Application Insights resource within the Azure Portal.
- Configure Application Insights within a .NET Core web application from a connection string within an appSettings.json file.
- Configure .NET Core web controllers to use an Application Insights telemetry instance.
- Embed custom data collection commands from the Application Insights SDK into controller methods.
- Run basic reports in Application Insights Monitor to display values of custom metrics.
That is all for today’s post.
I hope you have found this post useful and informative.
Andrew Halil is a blogger, author and software developer with expertise of many areas in the information technology industry including full-stack web and native cloud based development, test driven development and Devops.


