Welcome to today’s post.
In today’s post I will discuss how to use Application Insights to track application dependencies within an ASP.Net Core web application.
In a previous post I gave an overview of how Application Insights telemetry is enabled and analyzed within an ASP.NET Core web application. I also showed how to embed custom metrics within an application and how the data collected is reported within an Application Insights instance in Azure.
Before I proceed to show how to configure and enable dependency tracking in an ASP.NET Core web application, I will explain why we would use dependency tracking.
When an application is running and we would like to determine the performance of the application that has at least one or more dependencies and the root causes of application exceptions, we can track dependencies that are called within an application.
Types of dependencies include:
- HTTP web requests to network or API services.
- SQL query execution calls.
- File (read, write, creation) based access.
- Exceptions
Before I explore the above dependency types, I will show how to enable and configure Application Insights dependency tracking within a .NET Core web application.
In the first section, I will show how to enable and configure application insights dependency tracking within a .NET Core application.
Enabling and Configuring Insights Dependency Tracking
In the Startup class in our application within the ConfigureServices() method, create an instance of application insight service options and enable the dependency tracking telemetry module as shown (under the namespace Microsoft.ApplicationInsights.AspNetCore.Extensions):
ApplicationInsightsServiceOptions appInsOptions = new ApplicationInsightsServiceOptions();
appInsOptions.EnableDependencyTrackingTelemetryModule = true;
services.AddApplicationInsightsTelemetry(aiOptions);
I will next show how to configure a connection for a SQL server data context within the application. We will then later track dependencies of the SQL server connection and its commands from application insights.
To integrate SQL into the .NET Core web application I used the following code snip to configure a connection string to a SQL database:
try
{
    services.AddDbContext<ApplicationDbContext>(options =>
    {
        options.UseSqlServer(Configuration.GetConnectionString("AppDbContext"));
    }
    catch
    {
        Console.WriteLine("Error: Cannot connect to database.");
    }
}
(We will also need to add and reference the NuGet package Microsoft.EntityFrameworkCore).
The data context is just a class we have defined with the following code snip (simplified without including any other tables):
public class ApplicationDbContext : DbContext
{
        public ApplicationDbContext(DbContextOptions<ApplicationDbContext> options)
            : base(options)
        {}

        protected override void OnModelCreating(ModelBuilder builder)
        {
            base.OnModelCreating(builder);
            builder.Entity<BookViewModel>().ToTable("Books");
        }

        public DbSet<BookViewModel> Books { get; set; }
}
Also, include entity framework core library with:
using Microsoft.EntityFrameworkCore;
In the next section, I will provide an example of an action method within a controller that runs a service method that runs a SQL query that will be tracked.
A Controller and Service Method that Executes an SQL Query
For a basic application controller action List() that runs an SQL query through entity framework data context I use the following controller:
public ActionResult List()
{
        BookListViewModel bookListView = new BookListViewModel()
        {
            ListHeading = "Book List!!",
            BookList = _bookService.GetBooks().GetAwaiter().GetResult()
        };
        return View("List", bookListView);
}
The method to retrieve the books, which is within a service class I have connected to the controller through dependency injection is shown below:
public async Task<List<BookViewModel>> GetBooks()
{
        List<BookViewModel> books = await _db.Books.ToListAsync();
        return books;
}
The association of the service class to its interface within the service collection is:
services.AddTransient<IBookService, BookService>();
In the next section, I will show how to cause an unhandled exception error from the database connection within the application that will then be tracked within application insights.
Inducing an Unhandled 500 Error from the Web Application
I will first show how to track exception errors within Application Insights from a running application. I did this by shutting down the windows service for the local SQL instance.
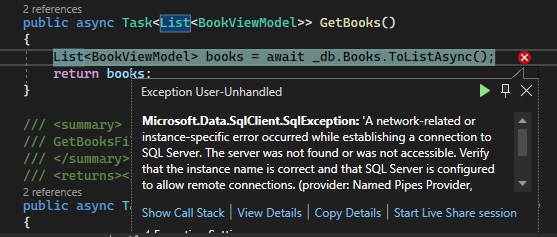
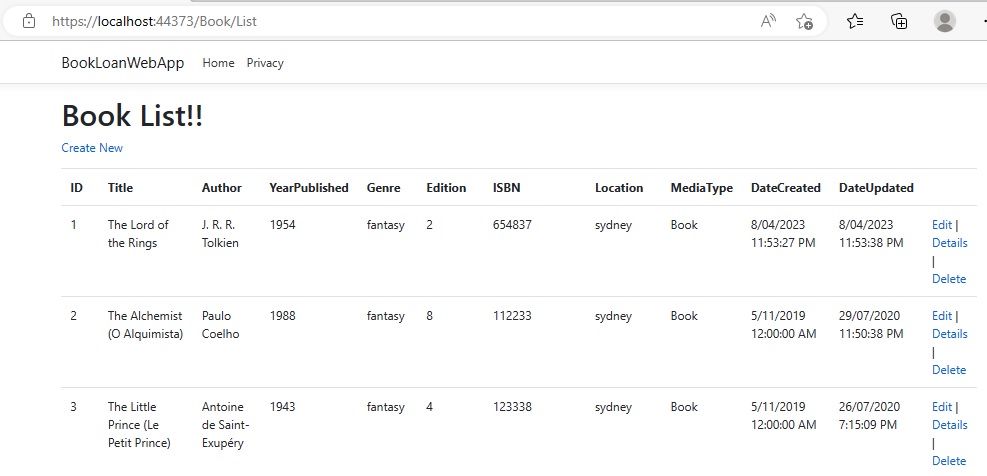
After building and running the application, I selected the List action in my landing page and got the following exception error:
Suppose we were the support engineer without any knowledge of the application code. To start an investigation from Application Insights, I would open the Application Insights resource overview page and notice the Failed requests graph shows failed requests in red/pink spikes as shown:

Before I show more details on the failed requests, I will show the Metrics report for the failed dependencies.
Viewing Number of Successful and Failed Dependencies
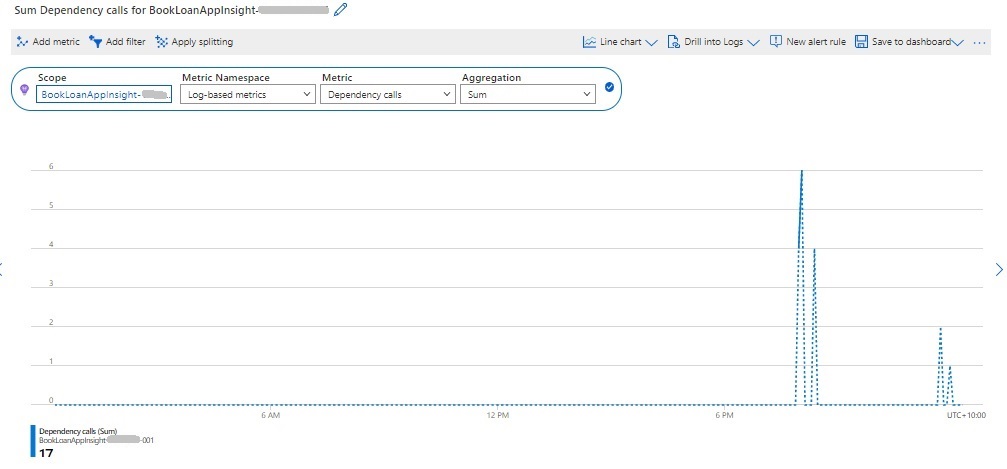
To view tracked application dependencies I open the Application Insights resource overview page and click on the Metric menu item on the left. In the report graph, the first metric parameters are shown.
Select Log-based-metrics under the Metric Namespace drop down filter and Dependency calls under the Metric drop-down filter as shown. When the filters are accepted, the report graph is shown below:
To display the number of failed dependencies, in the same report graph, select the Add metric action. In the filter that shows, select Log-based-metrics under the Metric Namespace drop down filter and Dependency failures under the Metric drop-down filter as shown. When the filters are accepted, the report graph is shown below:
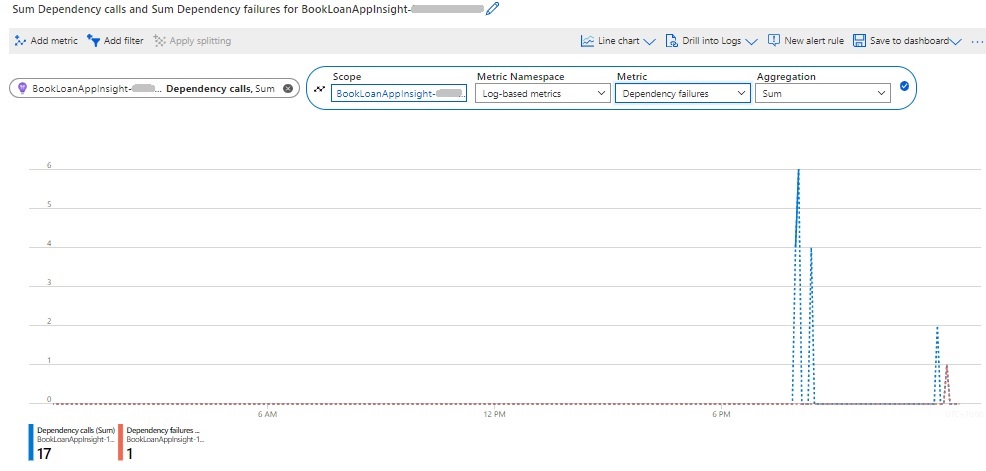
The red spike in the graph with a count of 1 corresponds to the failed request to our List controller action.
To display the number of exceptions, in the same report graph, select the Add metric action. In the filter that shows, select Log-based-metrics under the Metric Namespace drop down filter and Exceptions under the Metric drop-down filter as shown. When the filters are accepted, the report graph is shown below:
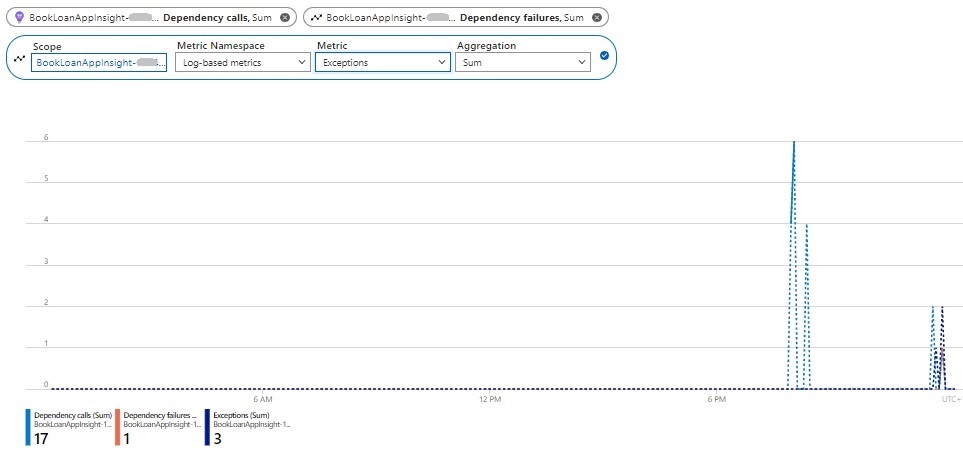
The dark blue spike in the graph with a count of 3 corresponds to three exceptions of the failed request to our List controller action.
In the next section, I will show how we can determine causes of the failed dependencies.
Determining Causes of Failed Dependencies
As I mentioned earlier, in the Application Insights resources overview, I click on the Server requests graph to drill into more details on the causes. I then select the Dependencies tab. We then see the graphs for the response time and operations.
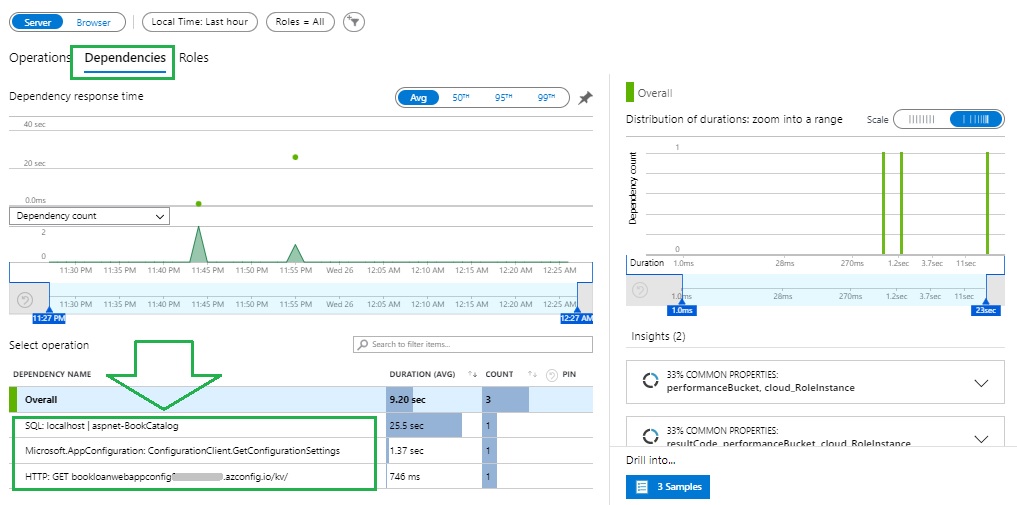
More obviously, we could also click on the Failed requests graph to open details on the failed requests, which is shown below.
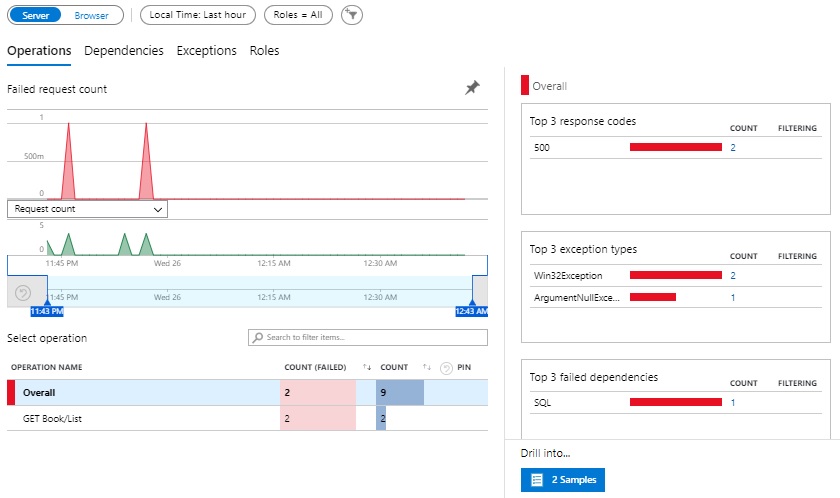
Below we can see two spikes in the Failed request count graph. In the Select operation grid we can see the number of failed operations. To the right, we can see the Top 3 response codes (such as 400, 401, 500 etc), top 3 exception types, and top 3 failed dependencies.
Back to the Server request details report, selection of the GET: Book/List operation reveals the Top 3 dependencies on a grid to the bottom right. These can include dependencies such as HTTP, SQL, AppConfiguration etc. Then drill down to one of these operations further by clicking on the blue Samples button shown below. This displays some sample operations which each show a status code of 500.
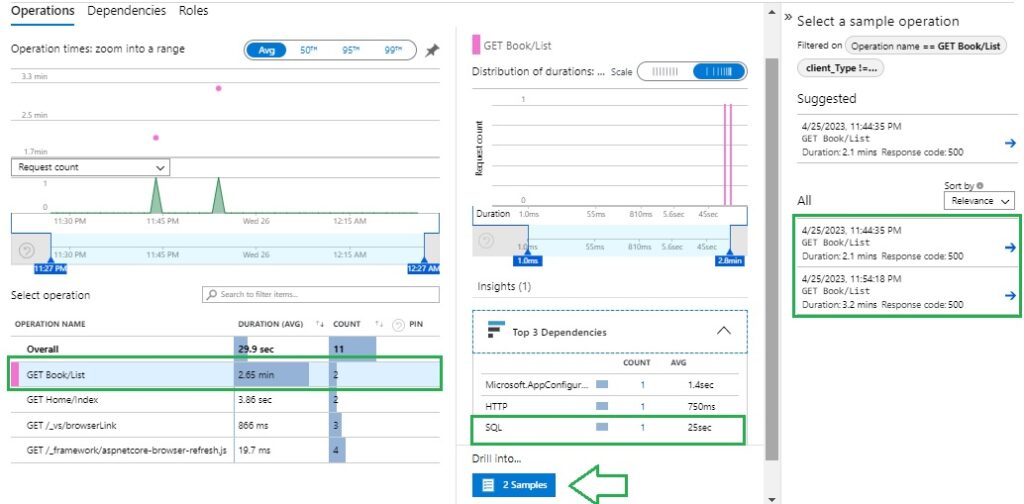
Clicking on one of the sample error operations displays the End-to-end transaction details report.
Here you will see the exception error transaction in red font in the grid to the left. By default, you will see the request details of the transaction.
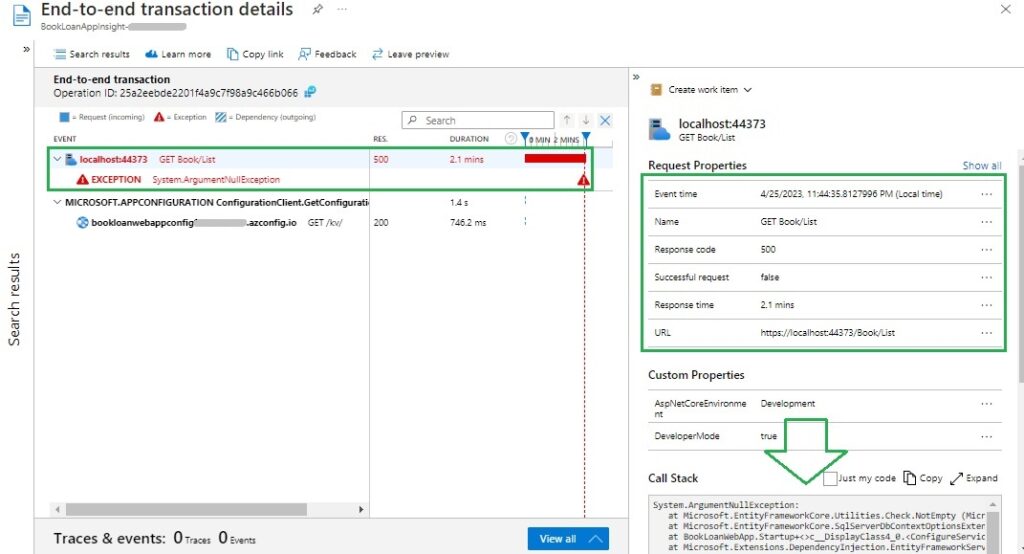
The request detail properties displayed are:
Event time
Name (of request)
Response code (=500)
Successful request (=false)
Response time
URL
In addition, we will see the call stack, which shows the full exception message, which we can copy and analyze further.
Clicking on this exception will display the exception details to the right.
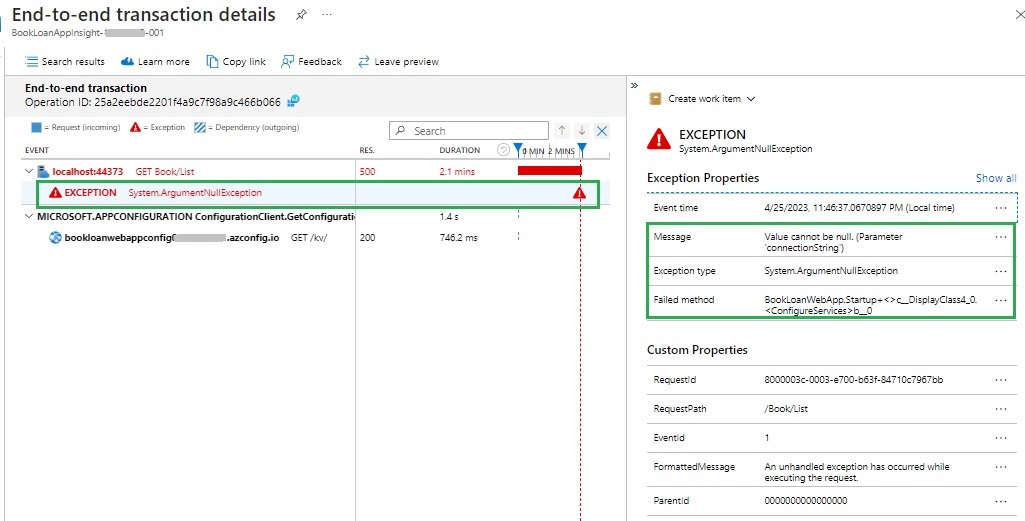
The exception details include the following properties:
Event time
Message
Exception type
Failed method
When an exception occurs in the application and is logged by the Application Insights telemetry module, the JSON output within the application log will show the exception (mostly trimmed for brevity) as:
Application Insights Telemetry:
{
    "name":"AppExceptions","time":"2023-04-25T13:57:30.8517287Z",
    "iKey":"…",
    "tags":
    {
        …
        "ai.operation.name":"GET Book/List","ai.location.ip":"::1",
        "ai.internal.sdkVersion":"il:2.21.0-429",
        …
    },
    "data":
    {
        "baseType":"ExceptionData",
        "baseData":
        {
            "ver":2,"exceptions":
            [{
                "id":47579246,
                 "outerId":0,
                "typeName":"Microsoft.Data.SqlClient.SqlException",
                "message":"A network-related or instance-specific error occurred while establishing a connection to SQL Server. The server was not found or was not accessible. Verify that the instance name is correct and that SQL Server is configured to allow remote connections. (provider: Named Pipes Provider, error: 40 - Could not open a connection to SQL Server)",
                "hasFullStack":true,"parsedStack":
                [{
                    …
In the next section, I will show how to determine application SQL dependency traces.
Determining Application SQL Dependency Traces
I will show how we can expose SQL commands within the End-to-end transaction details report.
This involves showing how to enable dependency tracking of SQL query calls using Application Insights.
In the source file for the Startup class include the following namespace:
using Microsoft.ApplicationInsights.DependencyCollector;
Then in the ConfigureServices() method add the following code to enable the dependency tracking telemetry module:
ApplicationInsightsServiceOptions appInsOptions = new ApplicationInsightsServiceOptions();

appInsOptions.EnableDependencyTrackingTelemetryModule = true;
To enable SQL command tracking we add the following code after the above code:
services.ConfigureTelemetryModule<DependencyTrackingTelemetryModule>((module, o) =>
{
    module. EnableSqlCommandTextInstrumentation = true;
});
We then build and run our application and open the List page.
In the Application Insights, click on the Server requests graph and you will see the report as shown (or refresh the report) in the Operations tab.
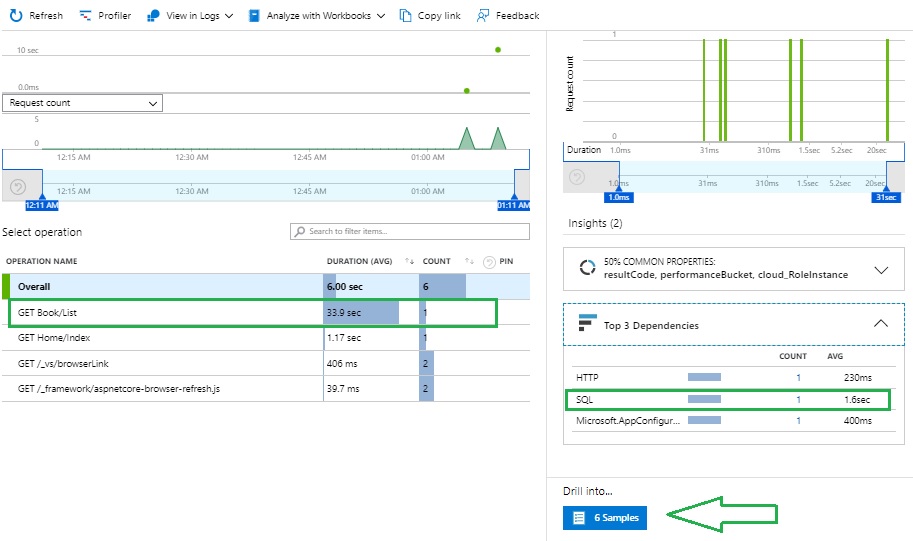
In the Top 3 dependencies, you will see the SQL dependency. Click on the Samples button to drill down on the dependency requests.
You will see the 6 dependencies, including two HTTP requests that are related to application HTTP controller requests.
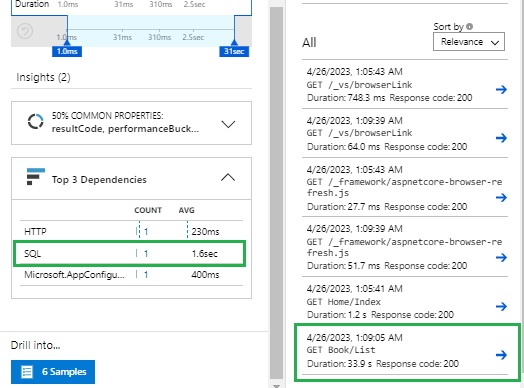
Click on the GET: Book/List request. This opens the End-to-end transaction report for the HTTP request. Then click on the transaction on the left where it shows the database name. To the right you will see the Dependency Properties where the following request properties show:
Event time
Type (=SQL)
Call status (=true)
Duration
Name (of database)
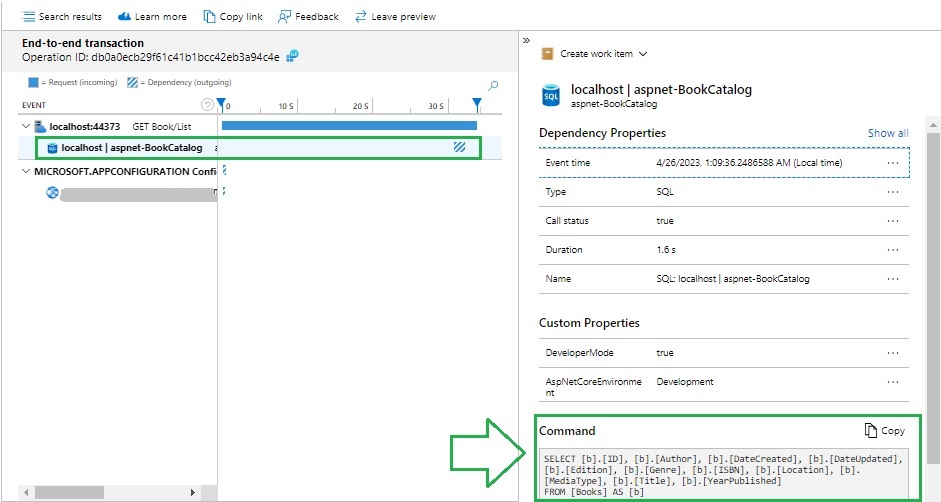
We can also view the actual SQL query that has been executed along with the duration of the request. This helps with performance analysis.
From the above reports, we can see how to use dependency tracking of Application Insights to analyse failures within an application and determine queries that can be used to further analyse performance.
We also saw how to use the Metrics reports to view the occurrences for the Dependency calls, Dependency failures, and Exception metrics.
That is all for today’s post.
I hope you have found the above post useful and informative.
Andrew Halil is a blogger, author and software developer with expertise of many areas in the information technology industry including full-stack web and native cloud based development, test driven development and Devops.

