
Welcome to today’s post.
In today’s post I will discuss how to use Redux Dev Tools to debug and trace Angular applications that use NgRx store.
In a previous post I showed how to install NgRx libraries and implement NgRx Store within an Angular application.
In this post I will explain what Redux Dev Tools are, how to install it, and how to use it to debug and trace NgRx objects within an Angular application.
What are the Redux Dev Tools?
The Redux Dev Tools is a developer productivity tool that is available as a browser extension. It allows you to debug and inspect the state of NgRx store objects that are created within the running web application. It allows you to inspect the Action, State and Diff NgRx objects.
If you are familiar with the existing Developer tools in Chrome and Edge browsers, then using the tool will be straightforward. It has a much richer interface than what we have with Developer tools. Finding data issues with hierarchies of objects in NgRx can be time consuming using console outputs or the built-in browser Developer tools, but the Redux Dev Tools makes the task easier.
Installing the Redux Dev Tools
Before you can use the Redux Tools extension you will need to install it into your browser.
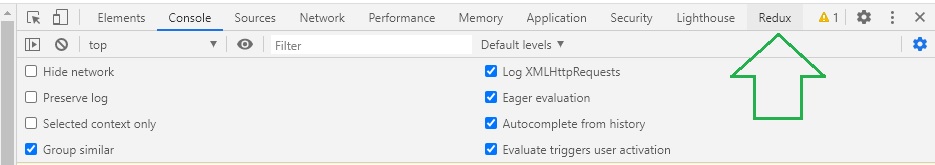
Once the extension is added to Chrome, open development tools and locate the menu named “Redux” shown below:
After expanding the extensions menu, you will see more options to pin or position the Redux tools window in your main display:

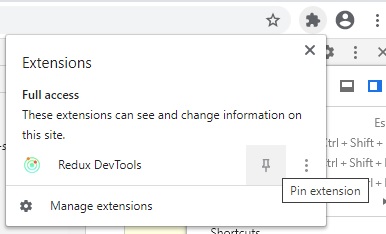
I would recommend pinning the Redux extension to your Chrome browser menu bar. This is done in the Extensions menu as shown:
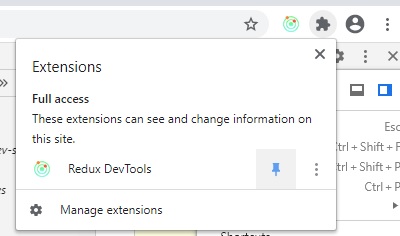
Once this is done you will see the Redux DevTools extension icon pinned to the left of the extensions icon in the browser toolbar:
In the next section, I will show how to use the debugging and tracing features to inspect NgRx data in a running Angular application.
Viewing Application State in Debug Mode
After running your application from Visual Studio Code in debug mode and launching your application, you will see the application data, state and actions from your Redux inspector:
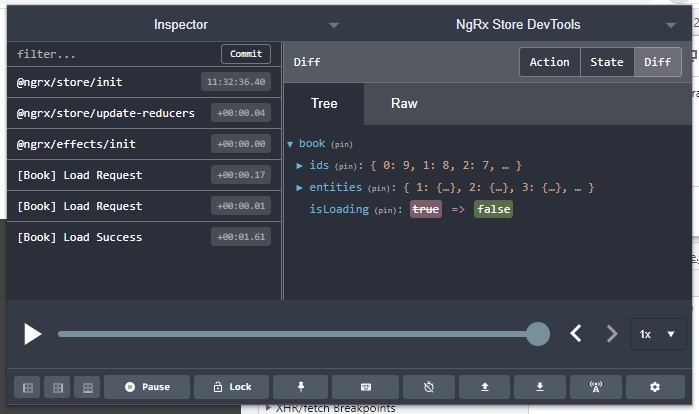
Selecting the State tab, you will see the data for each Book entity record loaded from the API by the Effects class:

The loading and error states are also shown to confirm the state of data loading the any error states.

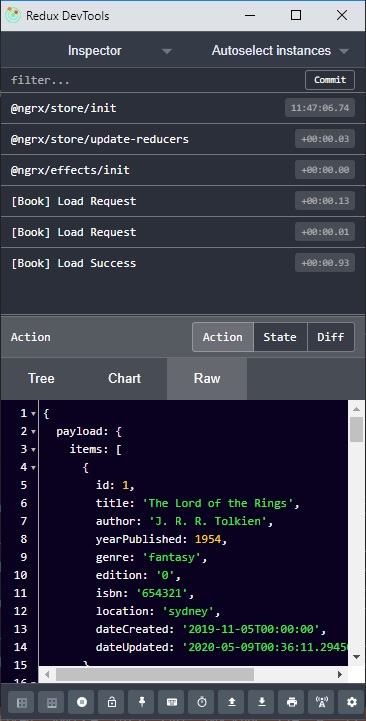
Clicking on the Raw tab will display the JSON representation of the entity data as shown:
To trace actions and associated data changes, click on the slider toolbar button as shown:

During playback, the actions (red arrow) will be played back and the associated reducer functions for each state and action will be executed to transition between states (green arrow).

This shows the power of NgRx store as a storage framework for persisting the data flowing within your application. Once we have built the actions and effects, then populate our NxRx store through the reducers, our components are then able to read the data through a selector.
We can see with the Redux tool how the external data is structured, populated and available for our application to utilize in the form of states and actions. The tool also serves as a useful development debugging and tracing tool for our Angular application. With the ability to play back through different states this helps to trace application state before and after specific actions without having to place debug breakpoints and analyze variables manually.
That’s all for today’s post.
I hope you found this post useful and informative.
Andrew Halil is a blogger, author and software developer with expertise of many areas in the information technology industry including full-stack web and native cloud based development, test driven development and Devops.

