
Welcome to today’s post.
In today’s post I will show how to test and troubleshoot a SignalR pipelines in ASP.NET Core. This will include those in both the server and client side.
In two of my previous posts, I showed how to implement a SignalR hub in ASP.NET Core and a SignalR client in Angular.
When implementing the SignalR server hub, the most useful diagnostic tools to use are debugging, console and log file output.
When implementing the SignalR client, the most obvious debugging tool to use is within the browser client itself and with Chrome we can use the console output to inspect logging output that comes from the client.
When running a SignalR hub that is running web APIs, one of the tools I can suggest using to test APIs is POSTMAN to post requests to an API service during an end to end test session.
In the next two sections I will go through how to add diagnostics and logging to SignalR Hubs and a SignalR client.
Enabling Diagnostics and Logging in a SignalR Hub Service
To enable logging application we use the following namespace in startup.cs:
using Microsoft.Extensions.Logging;
Then use the AddLogging() extension method to enable logging diagnostics and and configure console output and debugging output as shown:
..
using Microsoft.Extensions.Logging;
..

public void ConfigureServices(IServiceCollection services)
{
  services.AddLogging(loggingBuilder => loggingBuilder
    .AddConsole()
    .AddDebug());
	..
}
Within our application code, setting up the Logger service is done using dependency injection as shown:
internal class TimedHostedService : IHostedService, IDisposable
{
  private readonly ILogger _logger;
  ..

  public TimedHostedService(ILogger<TimedHostedService> logger,
    IHubContext<BookLoanHub, IBookLoanChange> bookLoanHub, .. )
  {
    _logger = logger;
    _bookLoanHub = bookLoanHub;
    ..
  }
..
And outputting log output is achieved using the LogInformation() method:
private void DoWork(object state)
{
  _logger.LogInformation("Timed Background Service is working.");
  ..
}
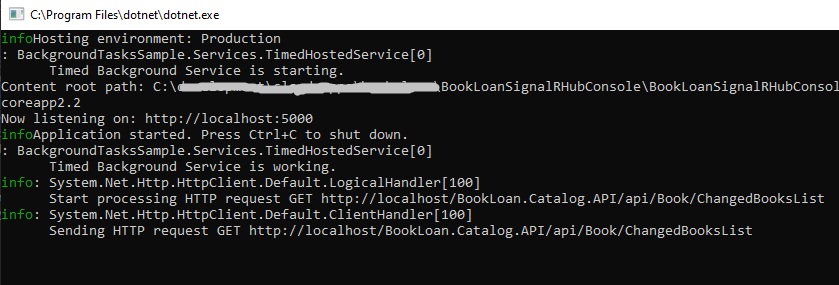
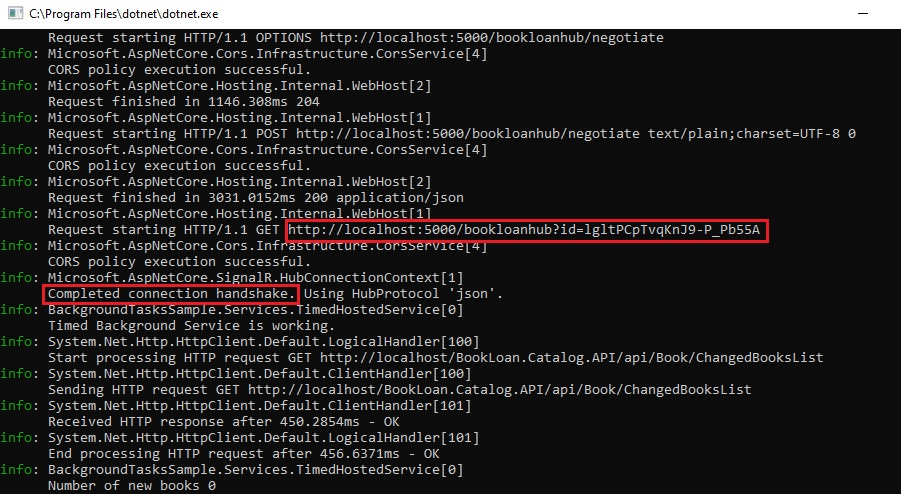
When run, the console application will output info filtered logs to the console as shown:
Debug logs will be output to the debug console within Visual Studio.
Diagnostics and logging in a SignalR Client
I will look at a SignalR client that is also a web client.
With an Angular 8 client I will show how to debug SignalR connections.
To receive a SignalR connection from a web client will require the SignalR server hub to be running.
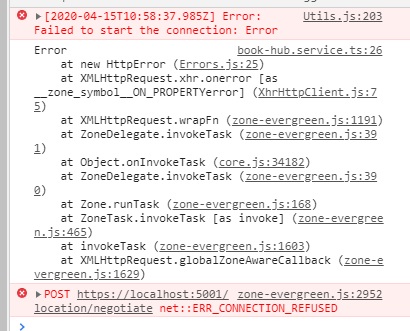
If the SignalR server is not running or CORS is not enabled on the SignalR service the following error will be shown in the Chrome developer console:
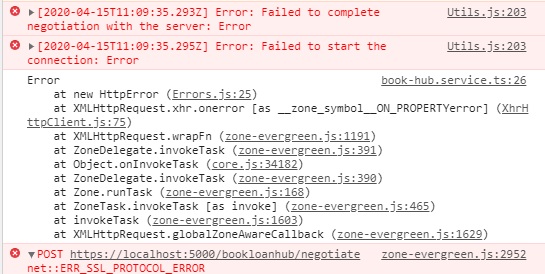
If the HTTP protocol is mismatched (i.e. HTTP tries to connect to HTTPS) between the SignalR server and client, the following error is shown:
A successful connection and handshake to the web client will show as follows:
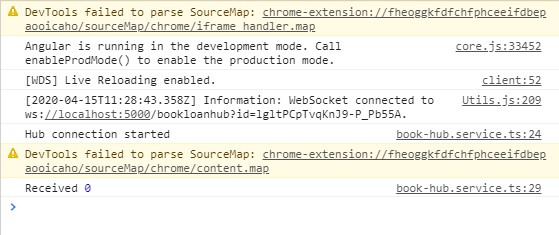
Logging the output to the Chrome console is done using the console.log() typescript method as shown:
this.connection.on('SendBookCatalogChanges', (bookchanges) => {
  console.log('Received', bookchanges);
  this.bookChanges.next(bookchanges);
The corresponding connection and handshake using the JSON protocol is shown in the SignalR server output console as shown:
In the next section, we will see how to test SignalR Hub API requests.
Testing SignalR Hub API Requests
To execute web API services that are used by your SignalR client you can either use a web client or use the free and popular POSTMAN utility to run requests.
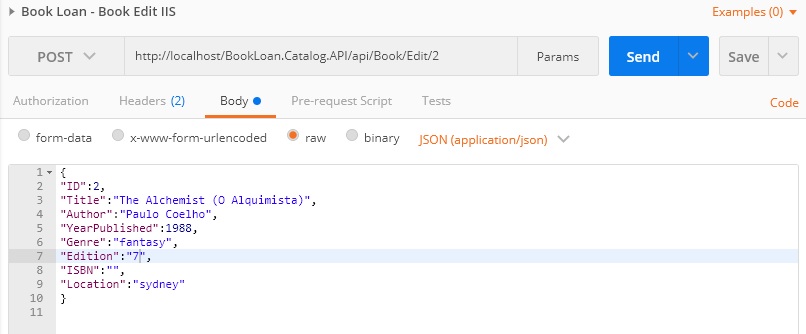
A common end-to-end test scenario is where you wish to run a web API to update a data store using a HTTP POST or PUT and then have the SignalR hub read the same SQL datastore from a web API HTTP GET in order to read then send push updates to a SignalR client.
A POST submission to update data is shown below:
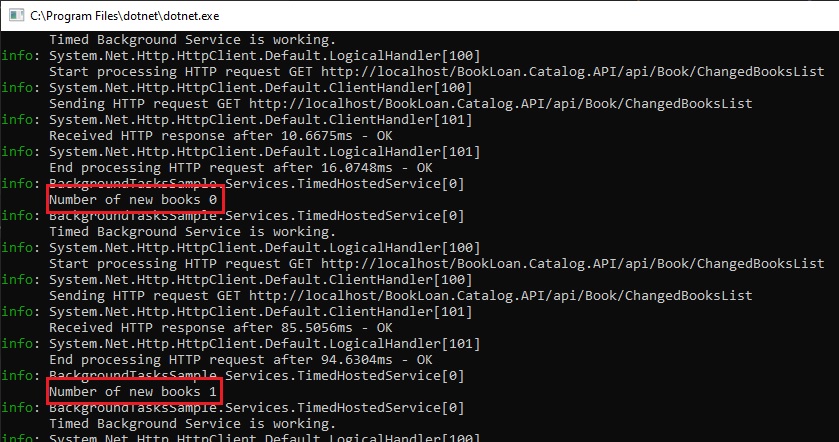
The SignalR hub console will show changing SQL data counts as shown:
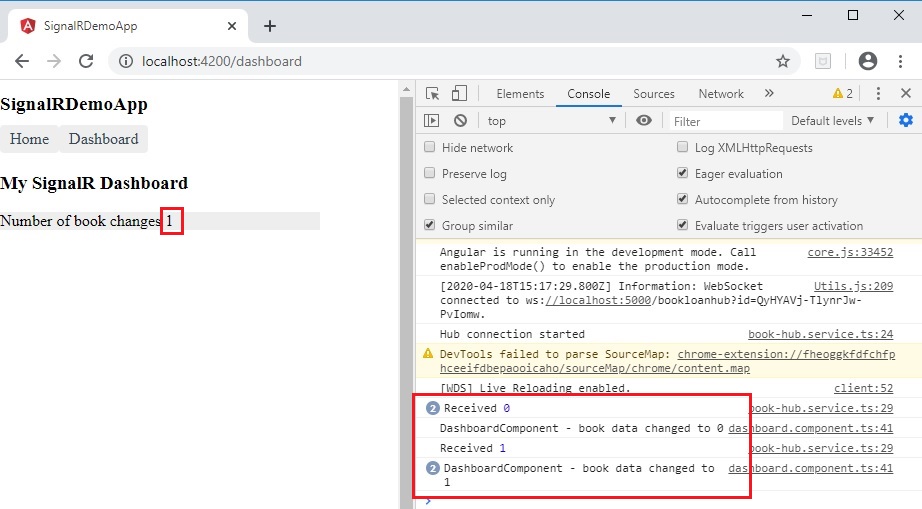
Below are the log outputs from the client in the browser.
The architectural diagram for the above SignalR server hub and client process is shown:
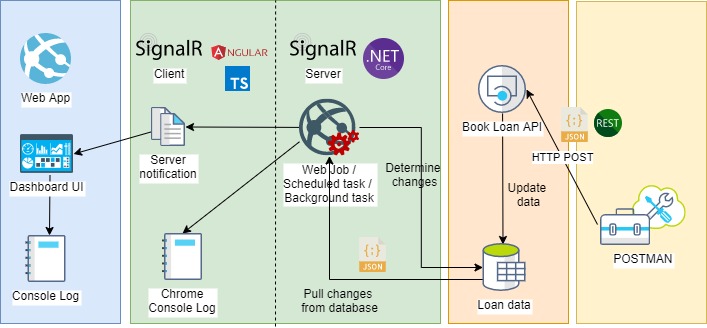
To summarize the testing and diagnostic steps for the above scenario:
- Submit an update using HTTP POST using POSTMAN.
- Loan data has a record inserted.
- SignalR server hub background task wakes up and runs SQL to determine number of recent changes.
- SignalR server hub logs to console.
- SignalR UI client receives server notification event from SignalR hub and displays result.
- SignalR UI client hub logs to browser console.
Summarizing the Troubleshooting Scenarios
I will now summarize the troubleshooting steps:
Notifications to look out for on the SignalR client
Failed to start the connection

Failed to complete negotiation with the serverExplanation: SignalR hub not started.
WebSocket connected to ..Explanation: SignalR Client confirmation of connection.
Notifications to look out for on the SignalR server
Completed connection handshakeExplanation: Server confirmation of connection.
I hope the above troubleshooting and observations are useful for your own troubleshooting journey with SignalR hubs and clients.
That’s all for today’s post.
I hope you found this post useful and informative.
Andrew Halil is a blogger, author and software developer with expertise of many areas in the information technology industry including full-stack web and native cloud based development, test driven development and Devops.

