
Welcome to today’s post.
One of the most useful tools we can configure into our continuous integration process within our development environment is a code analysis tool that allows the stakeholders within the project to keep track of the statistics relating to the ever-changing condition of the code base that is checked into the repository.
When a developer completes a code change, commits it, then pushes it to the feature branch through a pull request, the possibility of technical debt being introduced into the repository is possible. A code change and code reviews performed in a pull request in isolation of the rest of the repository sometimes does not expose issues that may be introduced from the change. One such oversight is when a developer introduces repeated code within the repository, which is one example of a code smell.
The higher-level issues relating to code coverage and code smells have been discussed in my past posts on clean code and code coverage. Quality code analysis tools provide detection of code smells, technical debt, and code coverage reports, which are useful to not only the development manager/team leader, but also the test/QA managers. Test coverage reports are discussed in a previous post where I show how to determine test code coverage statistics for code modules, statements, and functions.
The inclusion of code quality tools in a development client IDE such as TSLint have been discussed in a previous post and with SonarLint within TypeScript code.
The SonarCloud Code Quality Service
One such tool I have had the chance to evaluate is the SonarCloud product, which is a SaaS based code quality and analysis service that delivers timely reporting of code issues relating to a source code repository. Another variation of the product is SonarCube, which is a server-hosted code quality service. Both products can be integrated with a source code repository within an Azure DevOps organization.
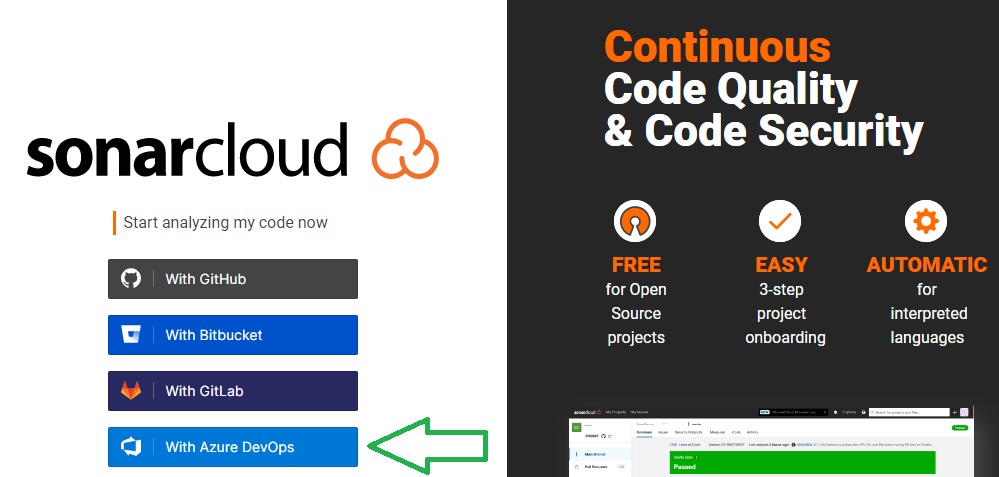
In this post I will be demonstrating how to integrate an Azure DevOps code repository with the SonarCloud code quality service.
The first part of configuration with SonarCloud is to connect through an Azure DevOps account. This can be done from the SonarCloud login page.
Under the terms and conditions of use provided of SonarCloud, source code provided in public projects that are part of a free or paid subscription, including any code metrics can be viewed by anyone viewing the projects. Any source code within a private project that is part of a paid subscription is treated as confidential and only visible to those with access to the project.
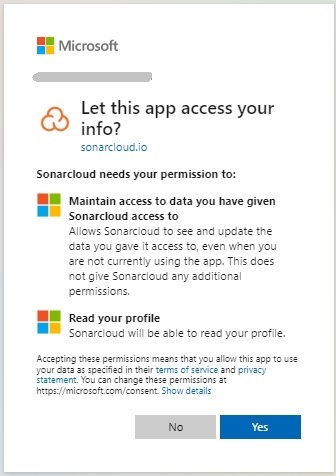
Accept the app data permissions info:
On the welcome screen you have the choice of joining an Azure DevOps organization or import an Azure DevOps organization.
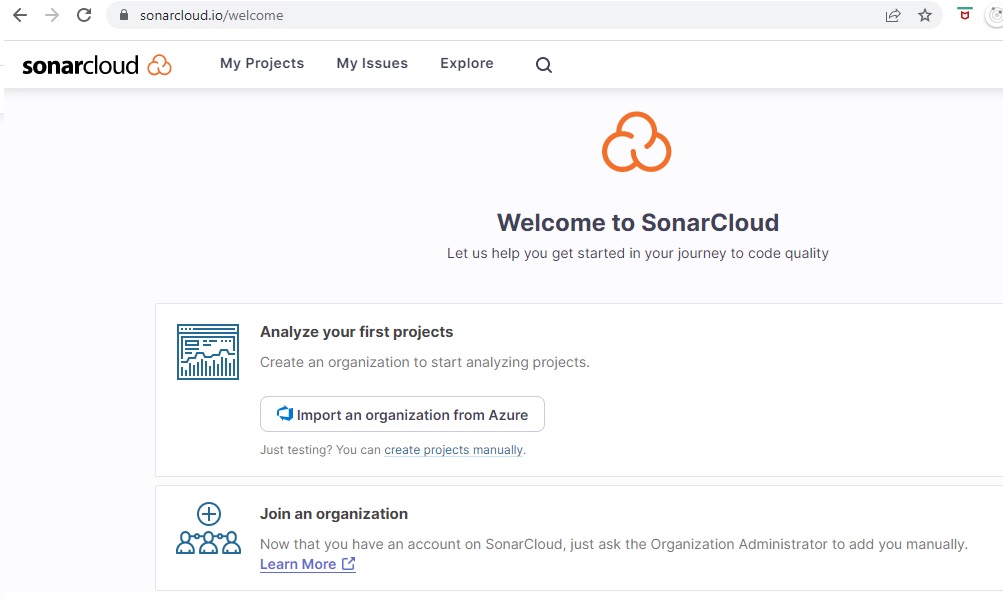
As I have an existing organization in my Azure DevOps account, I will choose the first option.
Importing an Azure DevOps Project into SonarCloud
Before importing an Azure DevOps project, recall that a public project can be free, and a private project requires a paid SonarCloud subscription.
If you have source code in a project that you wish to bring into the public domain as open source, be aware of exposing any potentially sensitive configurations and amend or obfuscate before pushing to the repository.
To switch a private project in Azure DevOps, the following task is helpful:
Under the organizational level, click on Organization settings, then under Security select Policies.
The Policies pane will then show:
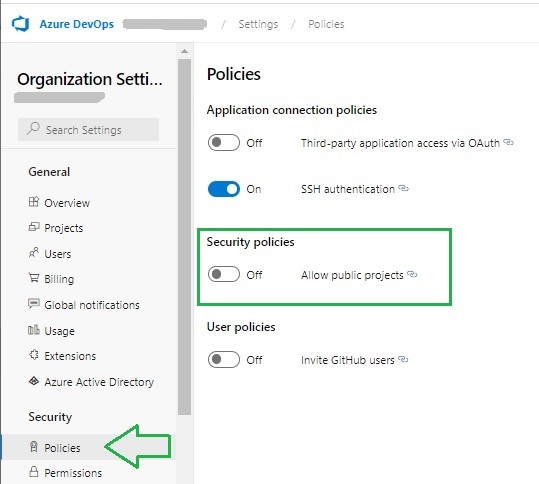
The reconfirm the organization policy.
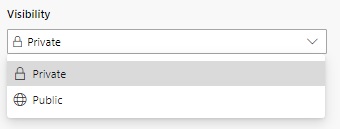
Next, open the project details of the project you wish to review the visibility settings. You will notice the Visibility drop down list will show, allowing you to select either a Private or Public project visibility:
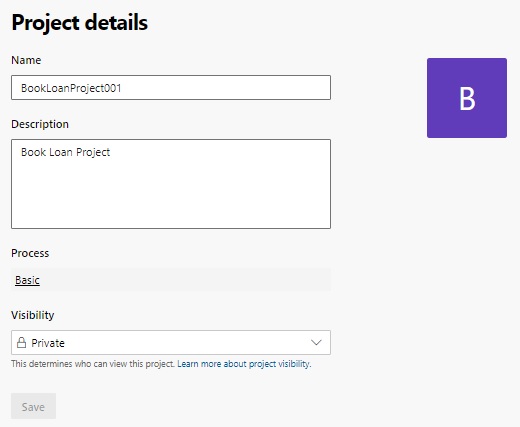
Selecting the Public option will make the project visible to other developers outside of the organization.
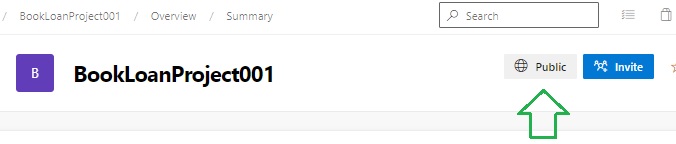
After saving the setting as a public repository, the project details will look as shown:
Now, return to the SonarCloud welcome screen shown earlier.
Select the option Import an organization from Azure:

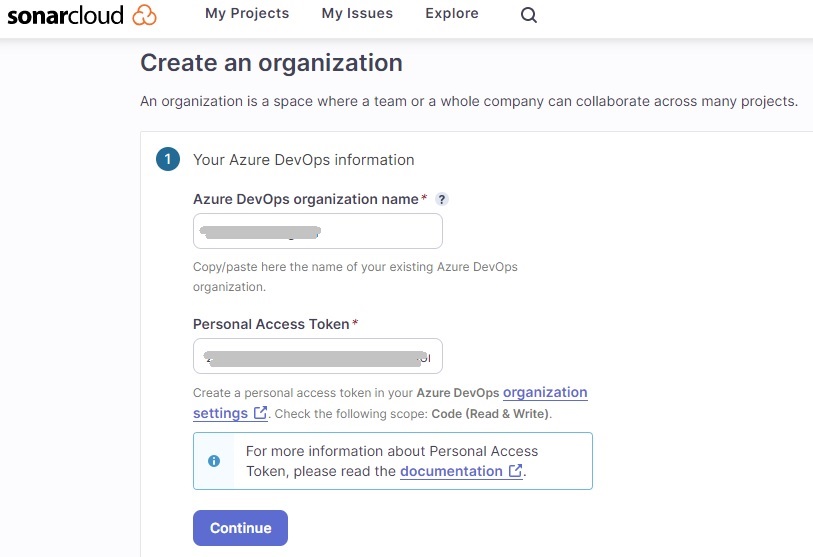
The following screen, Create an organization will show:
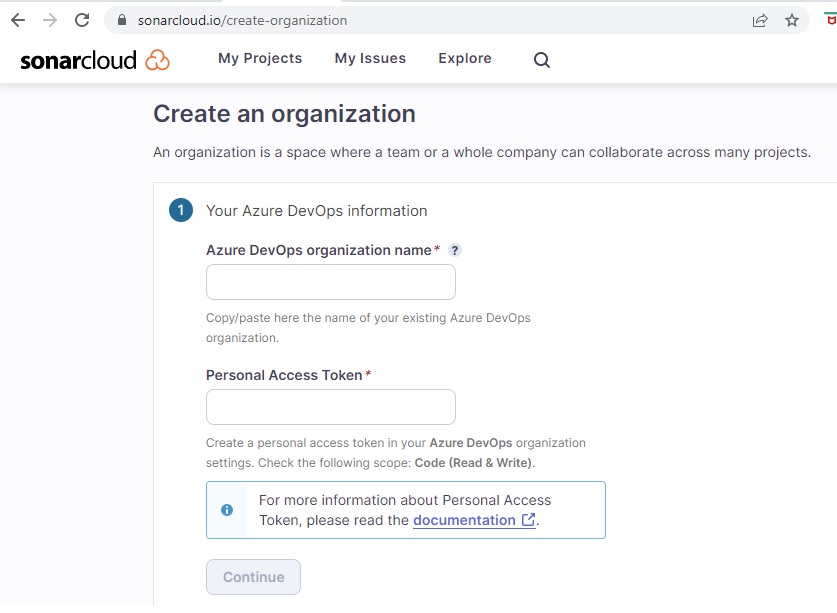
Enter the following details:
- Your Azure DevOps organization name.
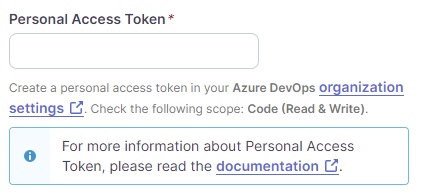
- Personal Access Token.
The first detail is straightforward, type in or copy and paste the name into the field. The second details a personal access token (PAT) created from your Azure DevOps organization.
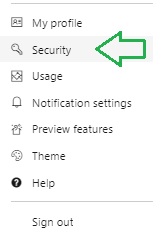
To create the PAT from your Azure DevOps organization, do as follows:
Under the account within Azure DevOps select Security:
The Personal Access Tokens pane, is shown is follows:
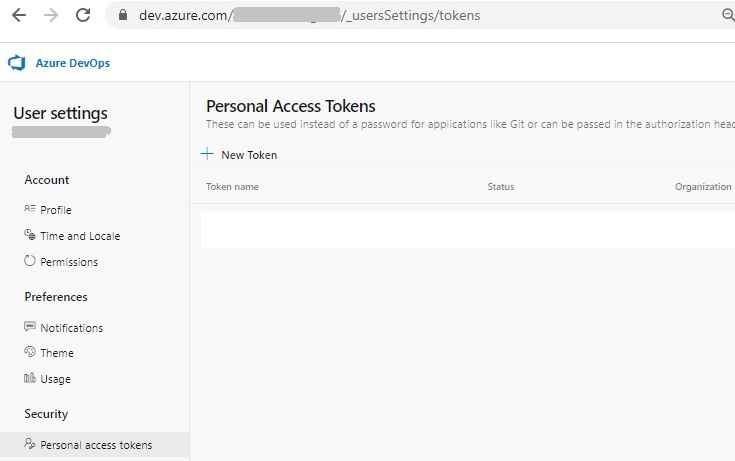
Click on New Token.
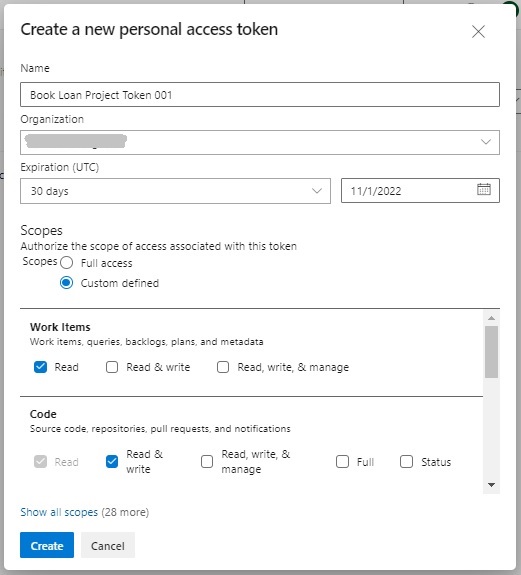
In the Create a new personal access token screen, enter the details to generate a new token with the Code (Read and Write) scope:
The generated token should then be copied, kept safe in a vault then pasted into the Personal Access Token field in the Create an organization dialog from the SonarCloud Azure DevOps configuration.
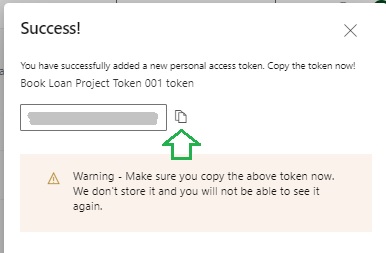
The token should be treated like a password as it provides access to your Azure DevOps projects and data. After the expiry date, a new token will need to be re-generated, and the third-party service (SonarCloud) will need re-connection.
Import the organization details:

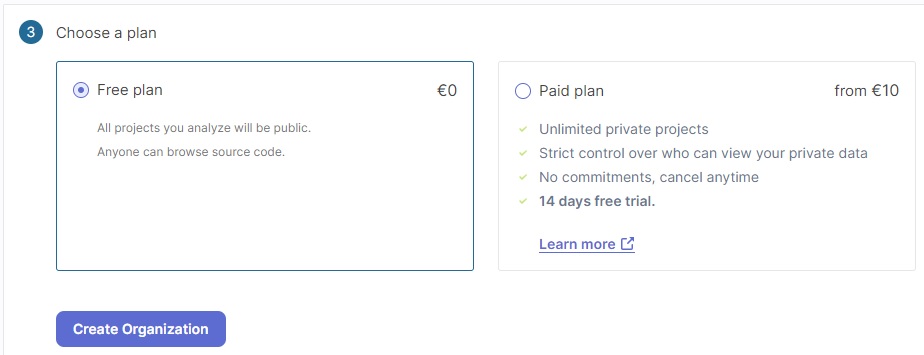
Next, you will need to select a plan. This can be the Free plan, where all projects in your organization that are analysed are of public visibility. The other option is the Paid plan, which analyses the private projects within your organization. In this case I will choose the Free plan then hit Create Organization.
The URL link to your organization projects is:
https://sonarcloud.io/organizations/[organization-name]/projects
In the next section, we will see how to analyze the Azure DevOps project codebase.
Analyzing the Azure DevOps Project Codebase
On your SonarCloud AzureDevOps Organization landing page, you will see two options:
Analyze a new project
AND
Add members
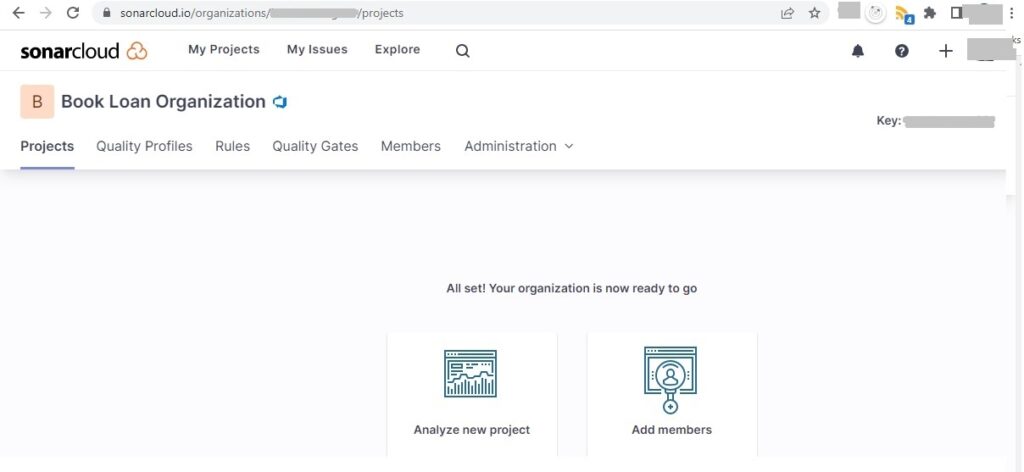
Select the option Analyze new project.
The Analyze projects – Select repositories screen now shows:
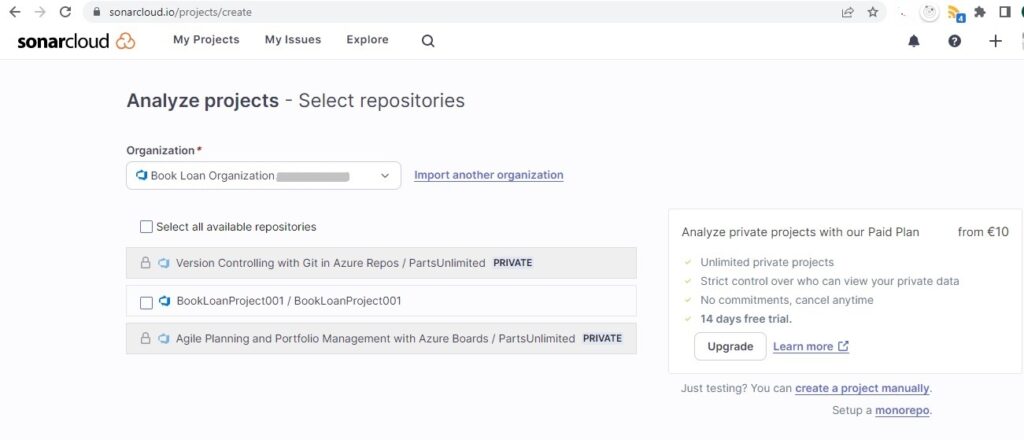
To enable analysis of private repositories will require an upgrade to the paid plan. In this case, I select the repository with public visibility:
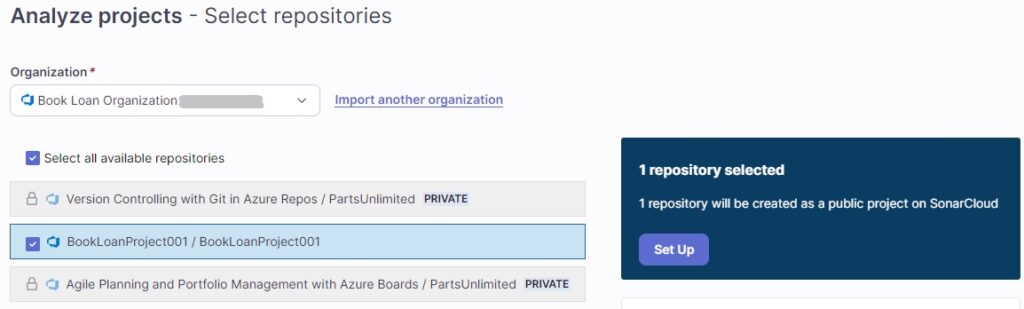
Click on the action Set up that is on the right.
The next screen is the configuration of the project analysis method in SonarCloud:
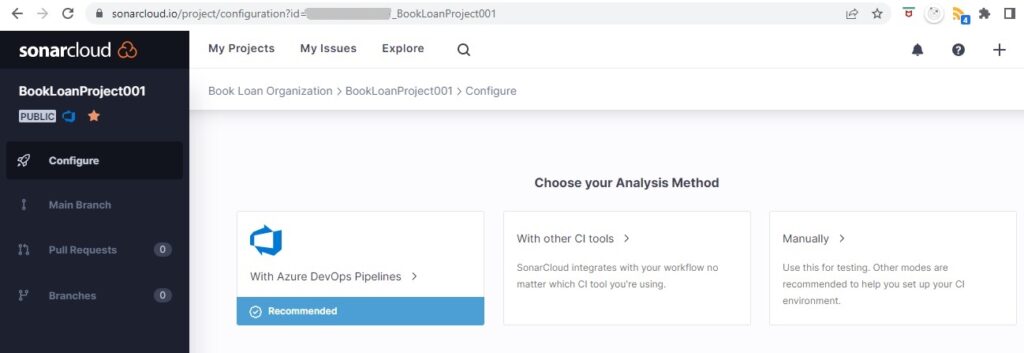
The choices are:
- Azure DevOps Pipelines (Recommended)
- Other CI Tools
- Manually
We select option 3. If we select option 1, which is recommended by SonarSource, even though we would have a free plan from SonarSource, the Azure Pipeline would have to be on a paid plan from our Azure subscription on an Azure Repo with public visibility. On Azure Repos with private visibility, you are provided with one free Azure pipeline.
I will select the .NET build, Windows OS and MSBuild .NET build tool.
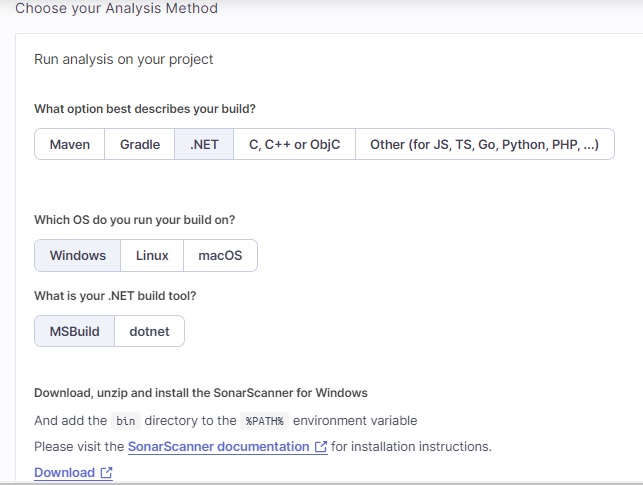
The command script to start the source scanner for MSBuild is shown:
SonarScanner.MSBuild.exe begin \
  /o:"[your-organization]" \
  /k:"[your-organization]_[your-project]" \
  /d:sonar.host.url="https://sonarcloud.io"
<insert_your_clean_build_command>
SonarScanner.MSBuild.exe end
The command script to start the source scanner for dotnet is shown:
dotnet sonarscanner begin \
  /o:"[your-organization]" \
  /k:"[your-organization]_[your-project]" \
  /d:sonar.host.url="https://sonarcloud.io"
<insert_your_clean_build_command>
dotnet sonarscanner end
Expand the downloaded ZIP sonar-scanner-msbuild-5.8.0.52797-netcoreapp3.0.zip into a folder on the server, say:
C:\Program Files\SonarScanner
Edit the SonarQube.Analysis.xml file and update the following configuration keys from the default values:
<SonarQubeAnalysisProperties  xmlns:xsi="http://www.w3.org/2001/XMLSchema-instance" xmlns:xsd="http://www.w3.org/2001/XMLSchema" xmlns="http://www.sonarsource.com/msbuild/integration/2015/1">
  <Property Name="sonar.host.url">http://localhost:9000</Property>
  <Property Name="sonar.login"></Property>
</SonarQubeAnalysisProperties>
to
<SonarQubeAnalysisProperties  xmlns:xsi="http://www.w3.org/2001/XMLSchema-instance" xmlns:xsd="http://www.w3.org/2001/XMLSchema" xmlns="http://www.sonarsource.com/msbuild/integration/2015/1">
  <Property Name="sonar.host.url">https://sonarcloud.io</Property>
  <Property Name="sonar.login">[your-pat-token]</Property>
</SonarQubeAnalysisProperties>
Save the file.
Add the path C:\Program Files\SonarScanner to the system environment PATH.
In our command we include the dotnet command to build the project within our folder:
dotnet build “C:\development\devops\[Project Name]”
For the .NET Core 2.0+ version of SonarScanner, you will need to refer to the path of the SonarScanner installation path, including the SonarScanner.MSBuild.dll library used to run the scanner follows the dotnet command as shown:
dotnet “C:\Program Files\SonarScanner\SonarScanner.MSBuild.dll” …
So, our scanning command will resemble the following:
dotnet “C:\Program Files\SonarScanner\SonarScanner.MSBuild.dll” begin \
  /o:"[your-organization]" \
  /k:"[your-organization]_[your-project]" \
  /d:sonar.host.url=https://sonarcloud.io
dotnet build “C:\development\devops\BookLoanWebApp”
dotnet “C:\Program Files\SonarScanner\SonarScanner.MSBuild.dll” end
If you get the following error when running the scanner:
java.lang.UnsupportedClassVersionError: org/sonar/batch/bootstrapper/EnvironmentInformation has been compiled by a more recent version of the Java Runtime
(class file version 55.0), this version of the Java Runtime only recognizes class file versions up to 52.0
then you may have a version of the Java SDK that is higher than the currently supported version of the Java SDK that the Java Runtime runs under. To remedy this, you can download the supported version of Java SDK and change the environment variable to the new SDK library folder:
Change the system environment variable value of JAVA_HOME from (version 8 Java SDK):
C:\Program Files (x86)\Java\jdk1.8.0_181
to (version 11 Java SDK)
C:\Program Files\Java\jdk-11.0.16
The SonarQube server and SonarScanner scanner requirements are detailed in the Sonar Cube documentation.
If you get this error:
ERROR: Error during SonarScanner execution
INFO: Total time: 44.515s
ERROR:
INFO: Final Memory: 20M/74M

INFO: ------------------------------------------------------------------------
The version of node.js (12) you have used to run this analysis is deprecated and we stopped accepting it.
Please update to at least node.js 14. You can find more information here: https://docs.sonarcloud.io/appendices/scanner-environment/
Then you will need to upgrade the version of Node.js to at least version 14 or higher, which is available from the following link.
Once the minimum version of Node.js and Java runtime have been installed, the scanner will run successfully.
Assessing the Code Quality from the Project Analysis Dashboard
Open the dashboard for the project on SonarCloud. You will see the following results:
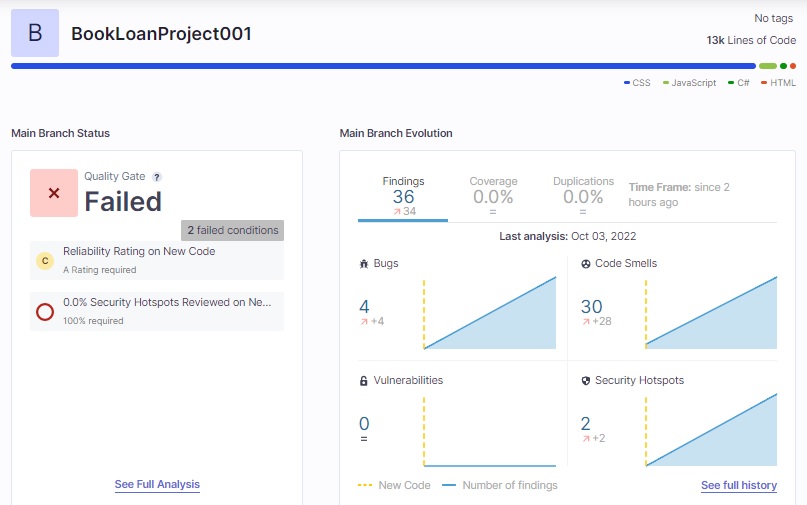
We can see the project quality is rated as Failed.
Observe that there are 4 bugs and 30 code smells. The number of bugs has caused the quality gate to fail.
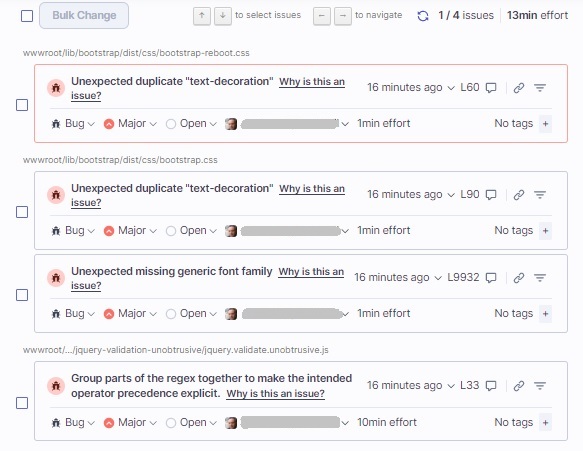
If we select the Bugs report, a view of the detected bugs is shown with the following details:
- Source code path.
- Detected issue description.
- Issue type (Code smell, Bug, Vulnerability).
- Severity (Blocker, Critical, Major, Minor, Info)
- Status (Open, Resolve as fixed, Resolve as false positive, Resolve as won’t fix)
- Assigned user
- Remediation effort (Development time to fix issue)
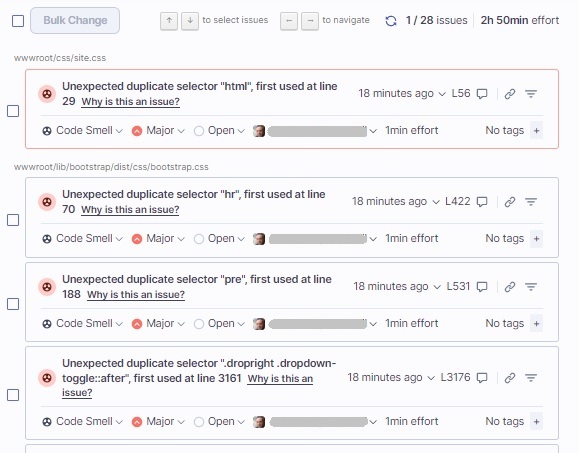
If we select the Code Smells report, a view of the detected code smells is shown with the same detail properties as for the Bugs report:
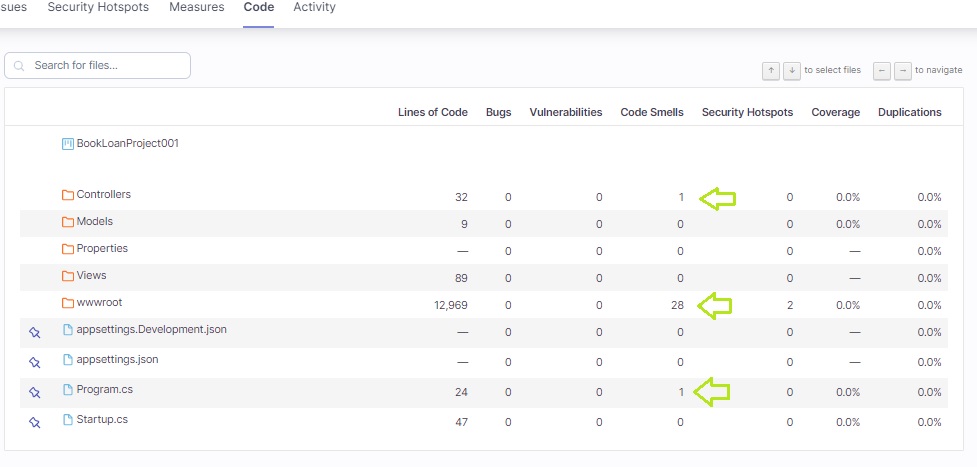
When we click on the See Full Analysis click and then select the Code tab, a tabular summary of the code analysis of the source code in the root folder. The following columns are displayed along with a count or percentage of each metric:
- Lines of Code
- Bugs
- Vulnerabilities
- Code Smells
- Security Hotspots
- Coverage
- Duplications
When we drill down into a folder, then one of the source files containing an issue, we can see the affected lines underlined in red warnings as shown:

Clicking on the nuclear sign to the right of the line number will show the description of the issue.
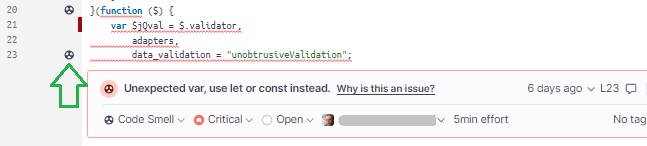
Clicking on the Why is this an issue? Link will show us why and how to remediate the code issue.
We can then assign the issue to a developer who can proceed to remediate the code base.
We have seen how to configure Azure DevOps to a code quality tool such as SonarCloud. This allows us to manage the quality of development changes to our code base and limit technical debt.
In future posts I will return to code quality and Azure DevOps.
That is all for today’s post.
I hope you have found this post both useful and informative.
Andrew Halil is a blogger, author and software developer with expertise of many areas in the information technology industry including full-stack web and native cloud based development, test driven development and Devops.

