Welcome to today’s post.
In today’s post I will be showing how to use the build-in reporting capabilities in Azure DevOps Services to provide useful status reports for release pipelines.
I will be showing how to utilize reports that report on the status of release pipelines that provide the following details:
- Status of the release (pass, fail, in-progress)
- Stage of the release (Development, Test, UAT, Production etc.)
- Percentage of success or failure.
- Color coded indicator (red = failure, green = pass, blue = in-progress)
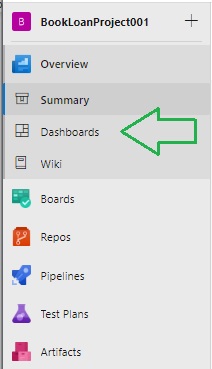
Before a release deployment report can be used, you will need to have an existing build pipeline, and a release pipeline. Creating and adding reports in Azure DevOps is done through the Dashboards menu in the context of a project.
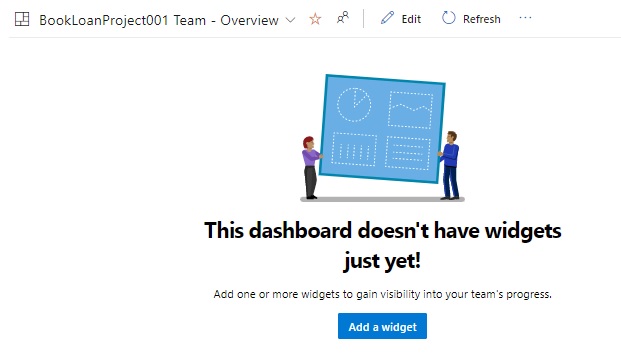
Once you are in the Dashboards pane, click on the Add a widget button to open the dashboard reports designer.
In the next section, I will show how to setup a dashboard report on the pipeline deployment status.
Reporting on Pipeline Deployment Status
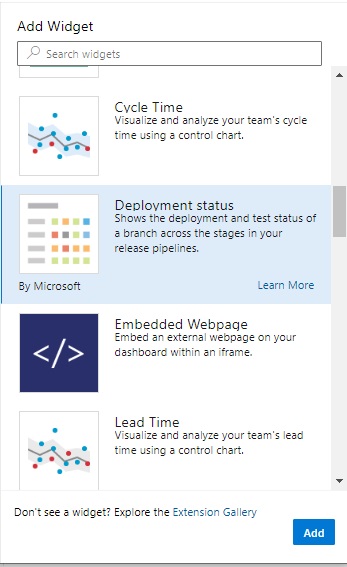
To the right of the dashboards canvas you will be presented with the widgets pane, which provides a wide range of reports widgets to select from. Scrolling down the list of report widgets until you see the Deployment status widget, then click on Add to select the report into the dashboard canvas.
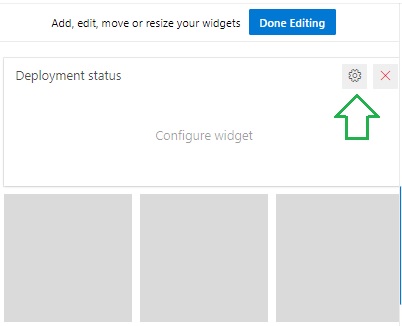
In the canvas area, the report will need to be configured before any useful data can be shown. To do this, click on the cog wheel on the top-right corner of the widget.
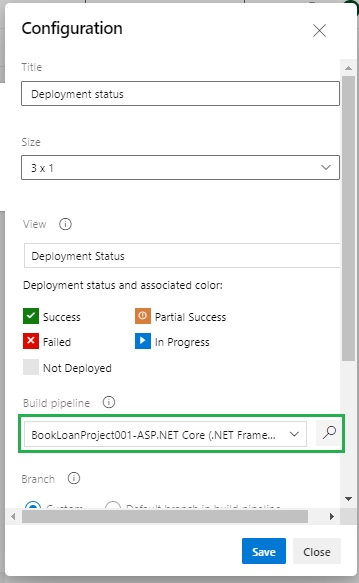
In the configuration dialog, you will see the first two properties, the title and size. With the size, the default size will be for a single-row dashboard widget. This is suitable for reporting on project releases that have a single deployment stage over three days. If your release pipeline has 2, 3 or more deployment stages, then the selected size can be 2, 3 column reports or more as 3×2, 3×3 and so on. For a three-stage release deployment over 5 days, the report size would then be 5×3.
The report view has two choices, a deployment status or test pass status.
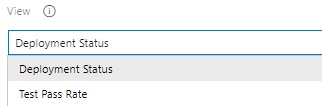
The deployment status exposes the deployment properties of a release pipeline job. The test pass rate exposes the test pass percentage rate of test tasks that are executed within the release pipeline job.
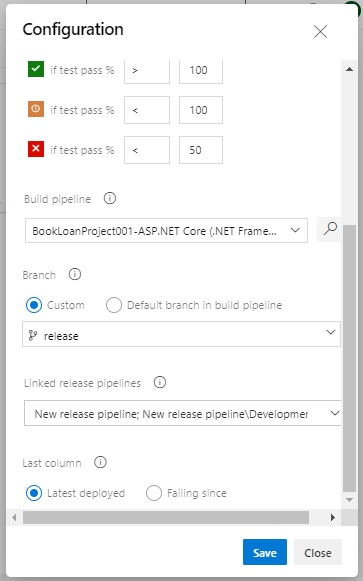
The next property, Build pipeline, defines the build pipeline to include in the report.
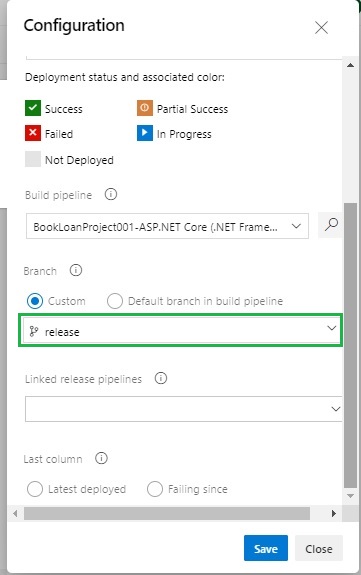
The report also requires the Branch property to be set to the repository that is built before the release pipeline commences. A multi-stage deployment release pipeline may include different build pipelines that depend on different repository branches (corresponding to development, test, production etc.)
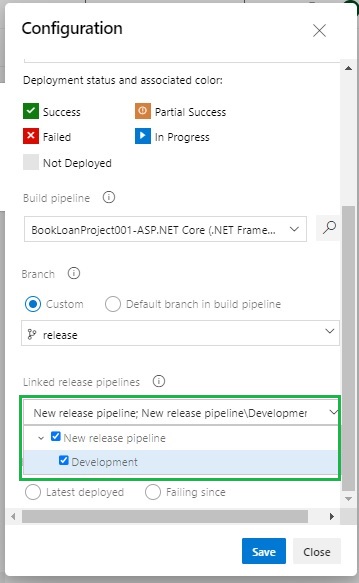
The Linked release pipelines property associates the build pipeline to an existing release pipeline stage.
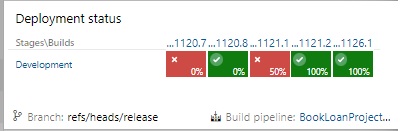
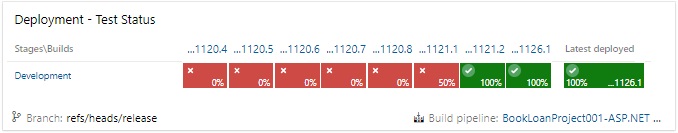
Once the release pipeline is selected in the configuration dialog, the dashboard widget will render in the dashboard canvas. In the report, green squared backgrounds with green badges correspond to a successful release, and a red squared background with a red cross correspond to a failed release. At the base of each release status square is a percentage that corresponds to any tests that have run during the build.
A slight variation of the rendered report is to show the last column as the latest deployed release or the first build that was the cause of a failed deployment.
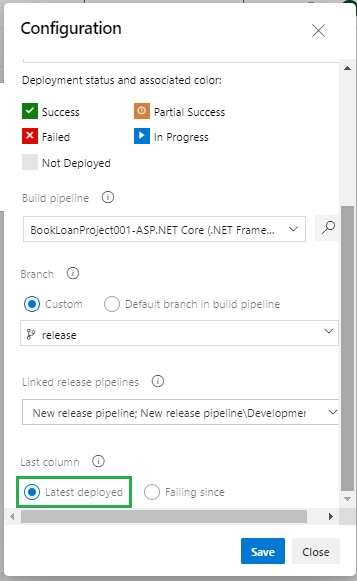
When the Latest deployed option is selected, the rendered release report will show the last column with the build number and test percentage in a wider column instead of having the build number in the column header.
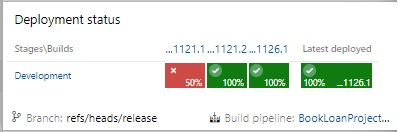
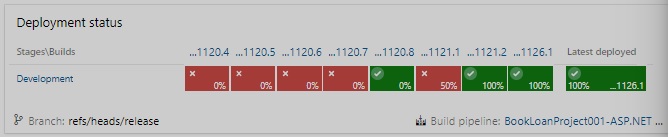
With a wider report size, the release dashboard looks as follows:
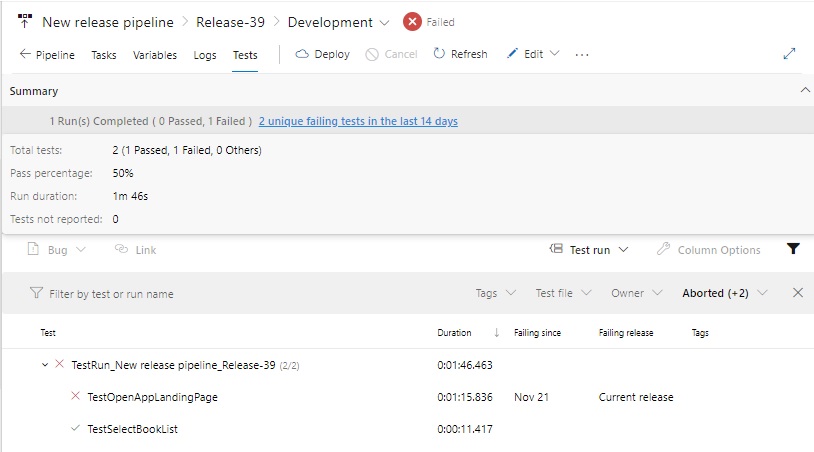
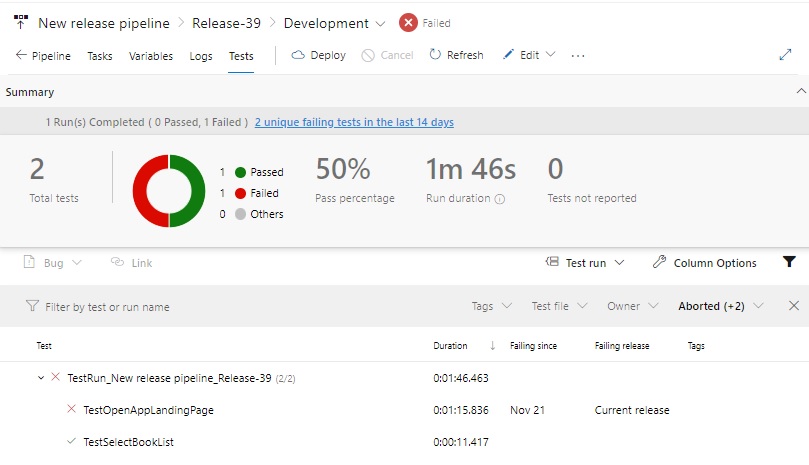
Clicking one of the deployment status boxes drills into the release details. In this case, the 50% status shows two E2E (end-to-end) tests run during the release pipeline’s deployment job. One test had passed, the other failed. In addition, the deployment job completed successfully, however the deployment tasks within the Development stage job completed with a failure of the tests.
Reporting on Pipeline Test Passing Rate
To be able to report on statistics of tests that run during a release pipeline, deployment tasks that integrate with existing E2E tests will need to be run, with the percentage of passing tests output from the pipeline job. Without tests being implemented in the release deployment job, relevant test results will not be visible from the release pipeline. In a build pipeline, we can of course include unit tests and/or code coverage and quality reports, which can be reported on during the reporting of build pipelines.
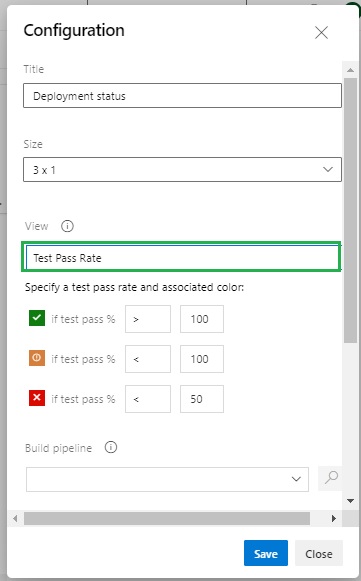
A dashboard report that displays the test pass rate within a release pipeline can also be configured with the same deployment release widget. I will explain the differences in the configured properties. With the View property, we select Test Pass Rate. Once selected, we are presented with the test percentage thresholds that are applicable for each status: pass, partial pass, and fail.
The remaining properties are identical to those for the deployment status report.
Once configured, the report looks like the rendered deployment release report except the status in each build stage corresponds to the test percentage.
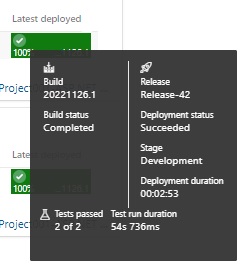
If we hover the mouse over one of the successful test status boxes, a summary of the build, deployment, duration, tests passed, and test run duration show in a neat box.
Clicking one of the test pass status boxes drills into the test details.
In this case, the 50% status shows two E2E (end-to-end) tests run during the release pipeline’s deployment job. One test had passed, the other failed.
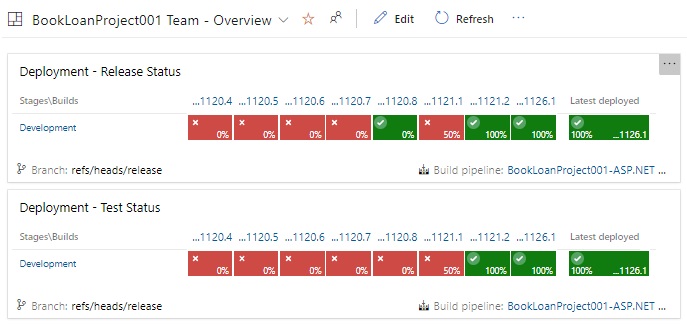
The combined deployment and test reports in the same dashboard are shown as follows:
We have seen how to create and configure dashboard reports for release pipelines in Azure DevOps, and how to use them to analyze deployment and pre-deployment E2E test runs.
That is all for today’s post.
I hope you have found this post useful and informative.
Andrew Halil is a blogger, author and software developer with expertise of many areas in the information technology industry including full-stack web and native cloud based development, test driven development and Devops.